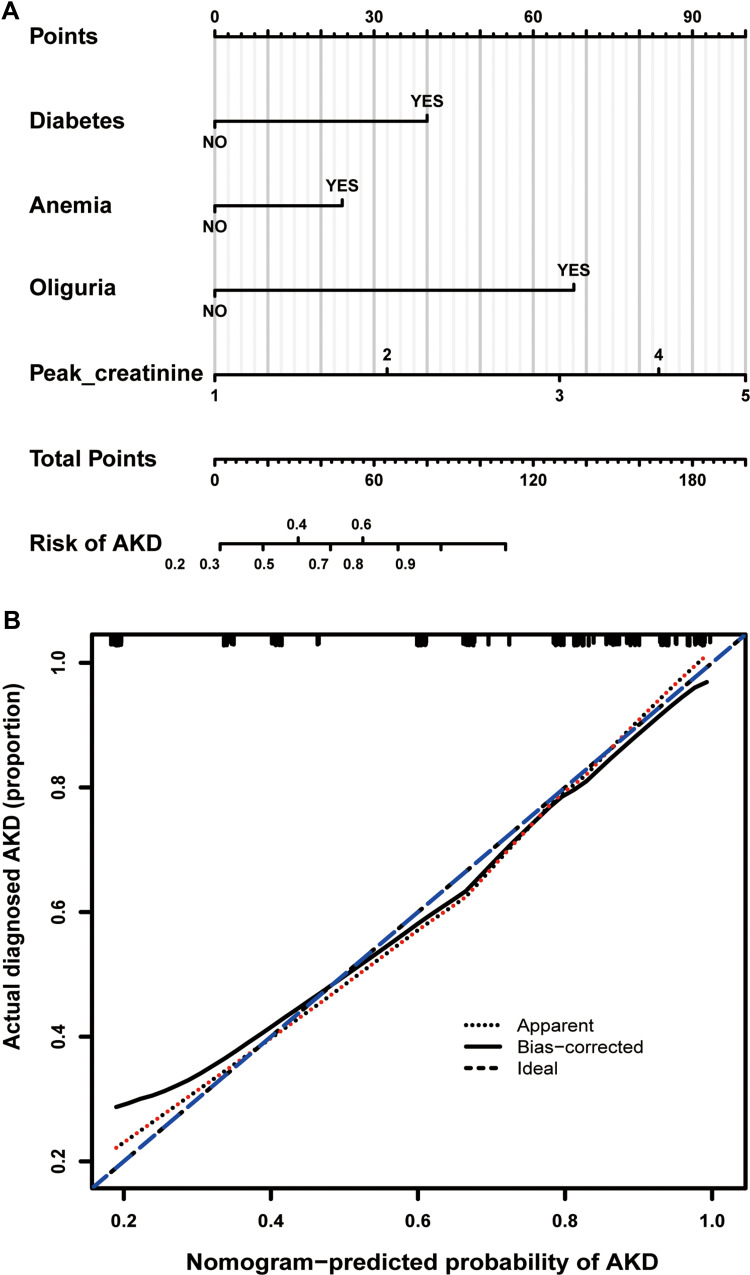
Figure 4.
Nomogram for predicting AKD risk and a calibration curve of the nomogram. (A) Nomogram to estimate the risk of AKD presence in AKI patients. The nomogram to predict AKD was created based on four risk factors (Diabetes, Anemia, Oliguria, and Higher Peak-creatine level). The points of each variable are added to correspond to the total points line. (B) Calibration curve of the AKD predictive nomogram. The x-axis represents the predicted AKD risk. The y-axis represents the actual diagnosed AKD. The apparent and the bias-corrected values are close to each other, indicating that the nomogram has a good predictive performance.

