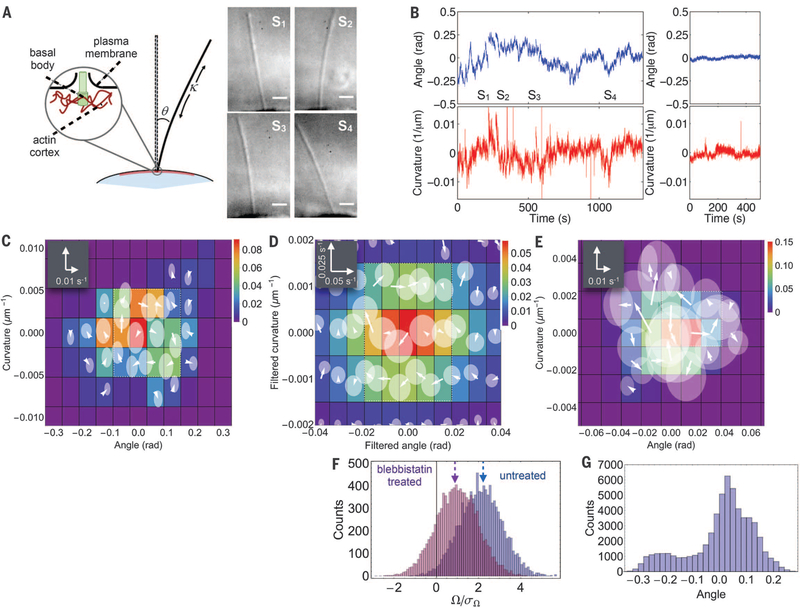
Fig. 3. Nonequilibrium fluctuations of MDCK-II primary cilia.
(A) Left: Schematic of primary cilium and anchoring of the basal body in the cell cortex with angle θ and curvature, κ, defined positive as shown. Right: Snapshots of cilium, from differential interference contrast microscopy, taken at time points marked in (B). Scale bar: 2 μm. (B) Angle (top) and curvature time series (bottom) of an active cilium (left) and of a blebbistatin-treated cilium (right). Frame rate: 25 Hz; scale bar: 2 μm. (C to E)Phase-space probability distribution (color) and flux map (white arrows) of ciliary fluctuations in CGPS spanned by θ and κ for (C): the untreated time series from (B); (D) a high-pass filtered time series of an untreated cilium (window size = 200 s); (E) the fluctuations of the blebbistatin-treated cilium from (B). The translucent disks represent a 2σ confidence interval for fluxes. (F) Distributions of flux contour integrals for untreated (purple) and blebbistatin-treated (pink) cilia. (G) Angle distribution for the high-pass filtered cilium data in (D).

