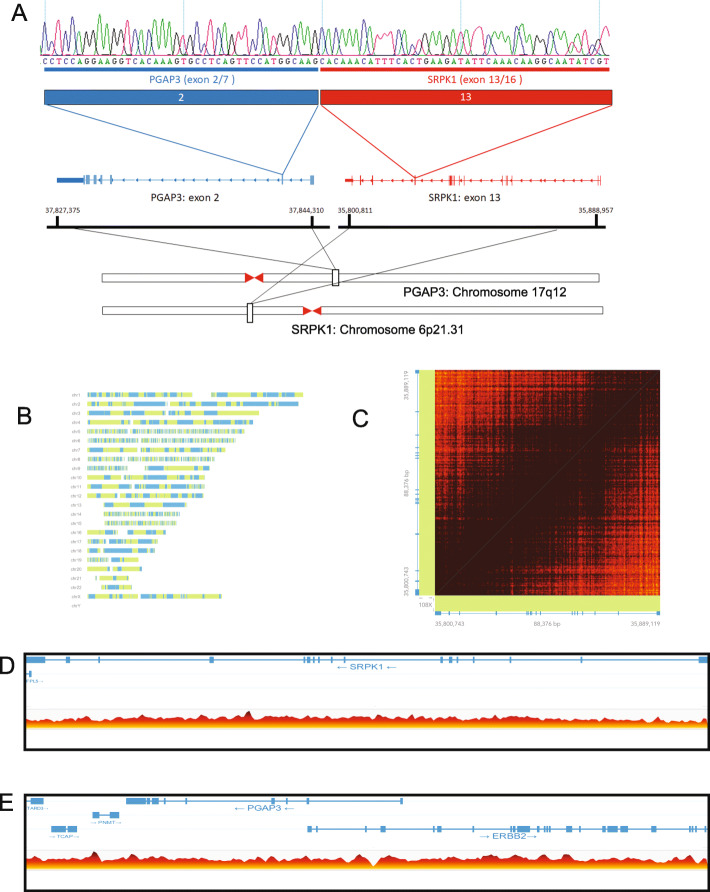
Fig. 4.
PGAP3-SRPK1 fusion gene and linked read genome sequencing. A) Schematic representation of the novel PGAP4-SRPK1 fusion gene. Exon 2 of PGAP3 is fused to exon 13 of SPRK1. B) Phase map summarizing linked read sequencing data as reported by the LongRanger and Loupe Analysis pipeline. C) Linked read matrix map showing high density coverage of linked reads over the SRPK1 locus. Dark brown indicates >30x coverage. D, E) Linear view of linked read data highlighting structural variations (indicated with colored lines, with horizontal bars indicating the direction of each paired read), for SRPK1 (D) and PGAP3 (E). Read coverage is shown on the bottom, ranging from white/yellow = zero reads to dark red = 26 reads

