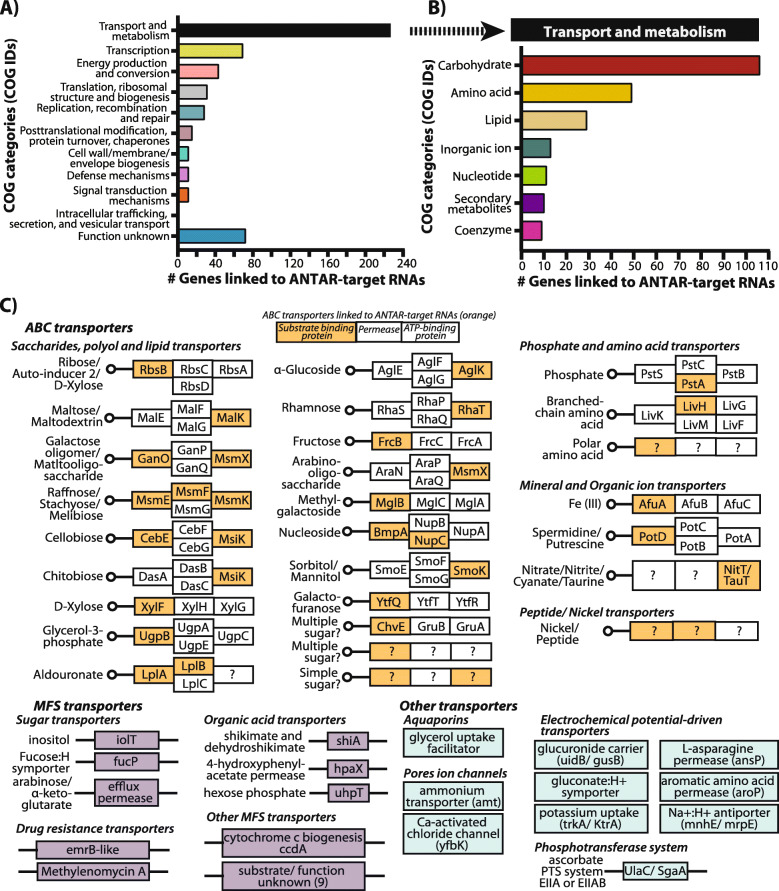
Fig. 4.
COG analysis of genes linked to ANTAR-target RNAs in actinobacteria. a Genes linked to ANTAR-target RNAs, analysed using EggNOG-mapper, get assigned to 11 COG categories. Bar plot shows distribution of genes linked to ANTAR-target RNAs, in each COG category. b Bar plot shows distribution of genes linked to ANTAR-target RNAs, within the ‘transport and metabolism’ COG category. Carbohydrate and amino-acid transport and metabolism are the major processes represented by the targets. c ABC transporters with the substrate binding protein, membrane bound permease and ATP-binding components (boxes) are shown. Components of the transporter whose functions are not known are marked (?). Transporter components whose transcripts harbor an ANTAR-target RNA are marked in orange. Genes linked to ANTAR-target RNAs, encoding MFS transporters (purple) and other transporters (blue) are shown

