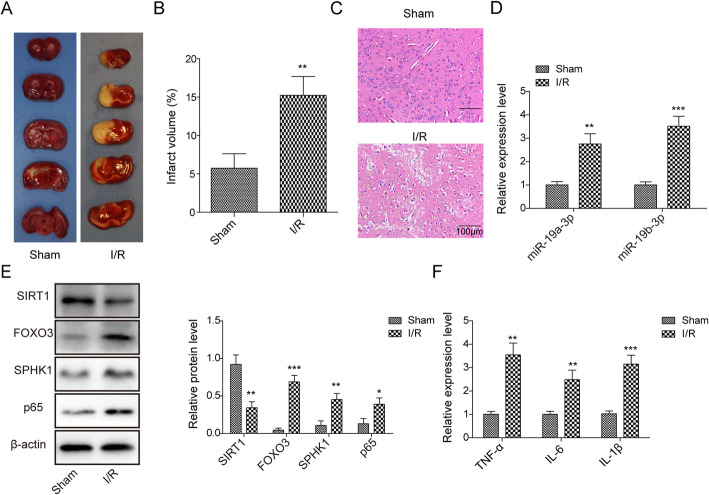
Fig. 1.
MCAO upregulated miR-19a/b-3p, FoxO3, and SPHK1, while downregulated SIRT1. a Representative images of TCC staining of brain sections from sham group or I/R group. b Quantifications of infarct volume in sham group and I/R group. c Representative images of H&E staining of brain sections from sham group or I/R group. d Relative miR-19a/b-3p levels in infarct tissues from sham group and I/R group. e Relative protein levels of SIRT1, FoxO3, SPHK1, and NF-κB p65 in infarct tissues from the sham group and I/R group. f Relative levels of inflammatory cytokines including TNF-α, IL-6, and IL-1β from sham group and I/R group. All the results were shown as mean ± SD (n = 3), which were three different experiments performed in triplicate. *P < 0.05, **P < 0.01, ***P < 0.01

