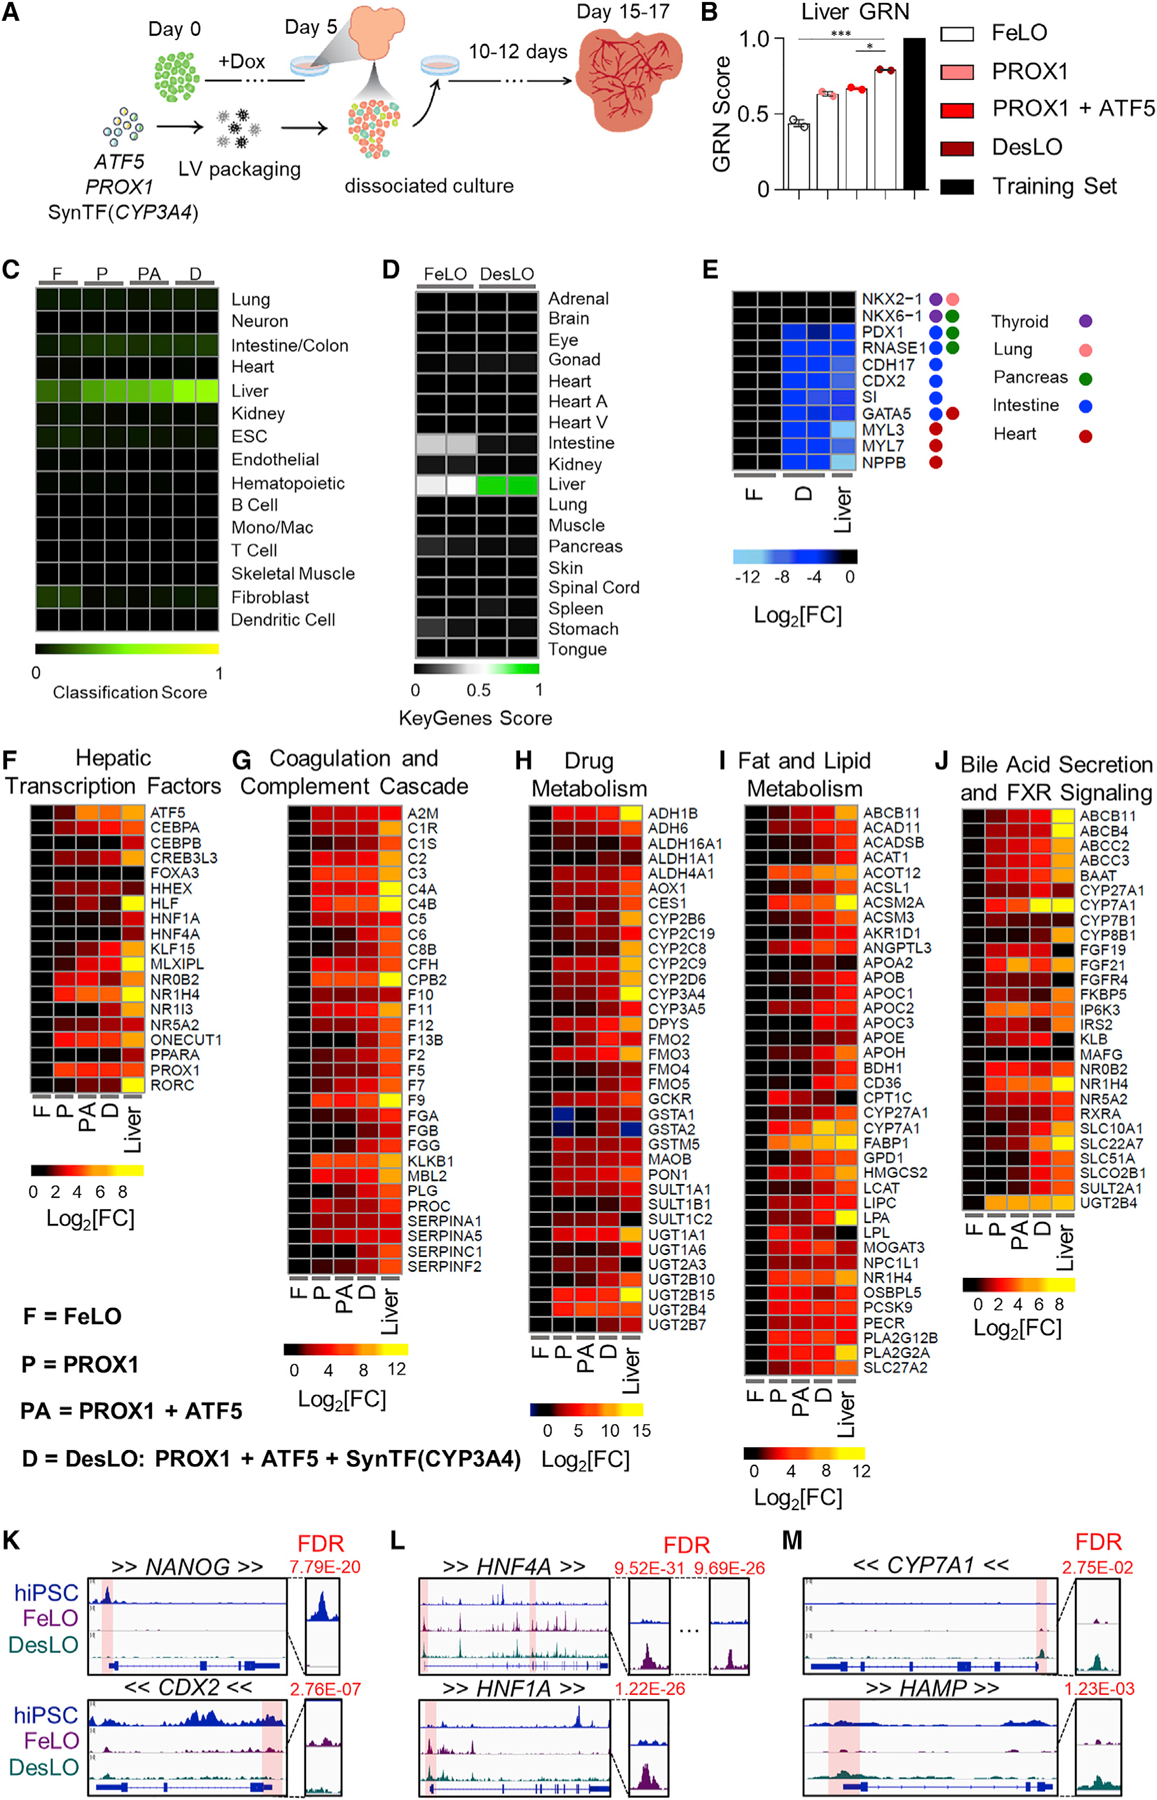
Figure 2. Genetic Engineering Improves Hepatic Identity and Tissue Maturation.

(A) Schematic of engineering strategy using dox-inducible GATA6 and lentiviral delivery of ATF5, PROX1, and SynTF(CYP3A4) gene circuits to develop DesLO. Full details in methods.
(B) Stepwise increase in CellNet liver GRN score by increasing the components transduced at day 5 from FeLO to DesLO in day 17 tissues. The training set represents the GRN score of the CellNet liver tissue library. *p < 0.05, ***p < 0.001 (n = 2). Significance determined by one-way ANOVA with Tukey’s multiple comparison test.
(C) Heatmap showing the CellNet classification scores for the listed tissues/organs or cell types for day 17 FeLO (F), PROX1 only (P), PROX1+ATF5 only (PA), and DesLO (D) samples (Mono/Mac: monocyte/Macrophage).
(D) Heatmap showing the KeyGenes scores for the listed tissues or cell types for day 17 FeLO and DesLO. (Heart A, Heart atrium; Heart V, Heart ventricle).
(E) Heatmap of gene expression in FeLO and DesLO from RNA-seq data highlighting decreased DesLO expression of aberrant lineages (values are relative to FeLO).
(F–J) Heatmaps showing enrichment in pathways relative to FeLO for hepatic transcription factors, complement and coagulation cascade, drug metabolism, cholesterol and lipid metabolism, glucose metabolism, and bile acid secretion and FXR signaling by increasing the components transduced at day 5 from FeLO to DesLO in day 17 tissues. (n = 2, mean shown, except liver n = 1).
(K) ATAC-seq results showing loss of chromatin accessibility on NANOG and CDX2 between hiPSCs, FeLO, and DesLO. FDR of differential peak comparison is indicated for the zoomed promoter regions highlighted in transparent red. Arrows around gene symbols represent the direction of transcription.
(L) ATAC-Seq results showing increases in chromatin accessibility in HNF4A and HNF1A between hiPSCs and FeLO. FDR of differential peak comparison is indicated for the zoomed promoter regions highlighted in transparent red. Arrows around gene symbols represent the direction of transcription.
(M) ATAC-seq results showing increases in chromatin accessibility in CYP7A1 and HAMP between FeLO and DesLO. FDR of differential peak comparison is indicated for the zoomed promoter regions highlighted in transparent red. Arrows around gene symbols represent the direction of transcription.
Data are represented as mean ± SEM for B, no SEM listed for the library training set.
See also Figure S2.
