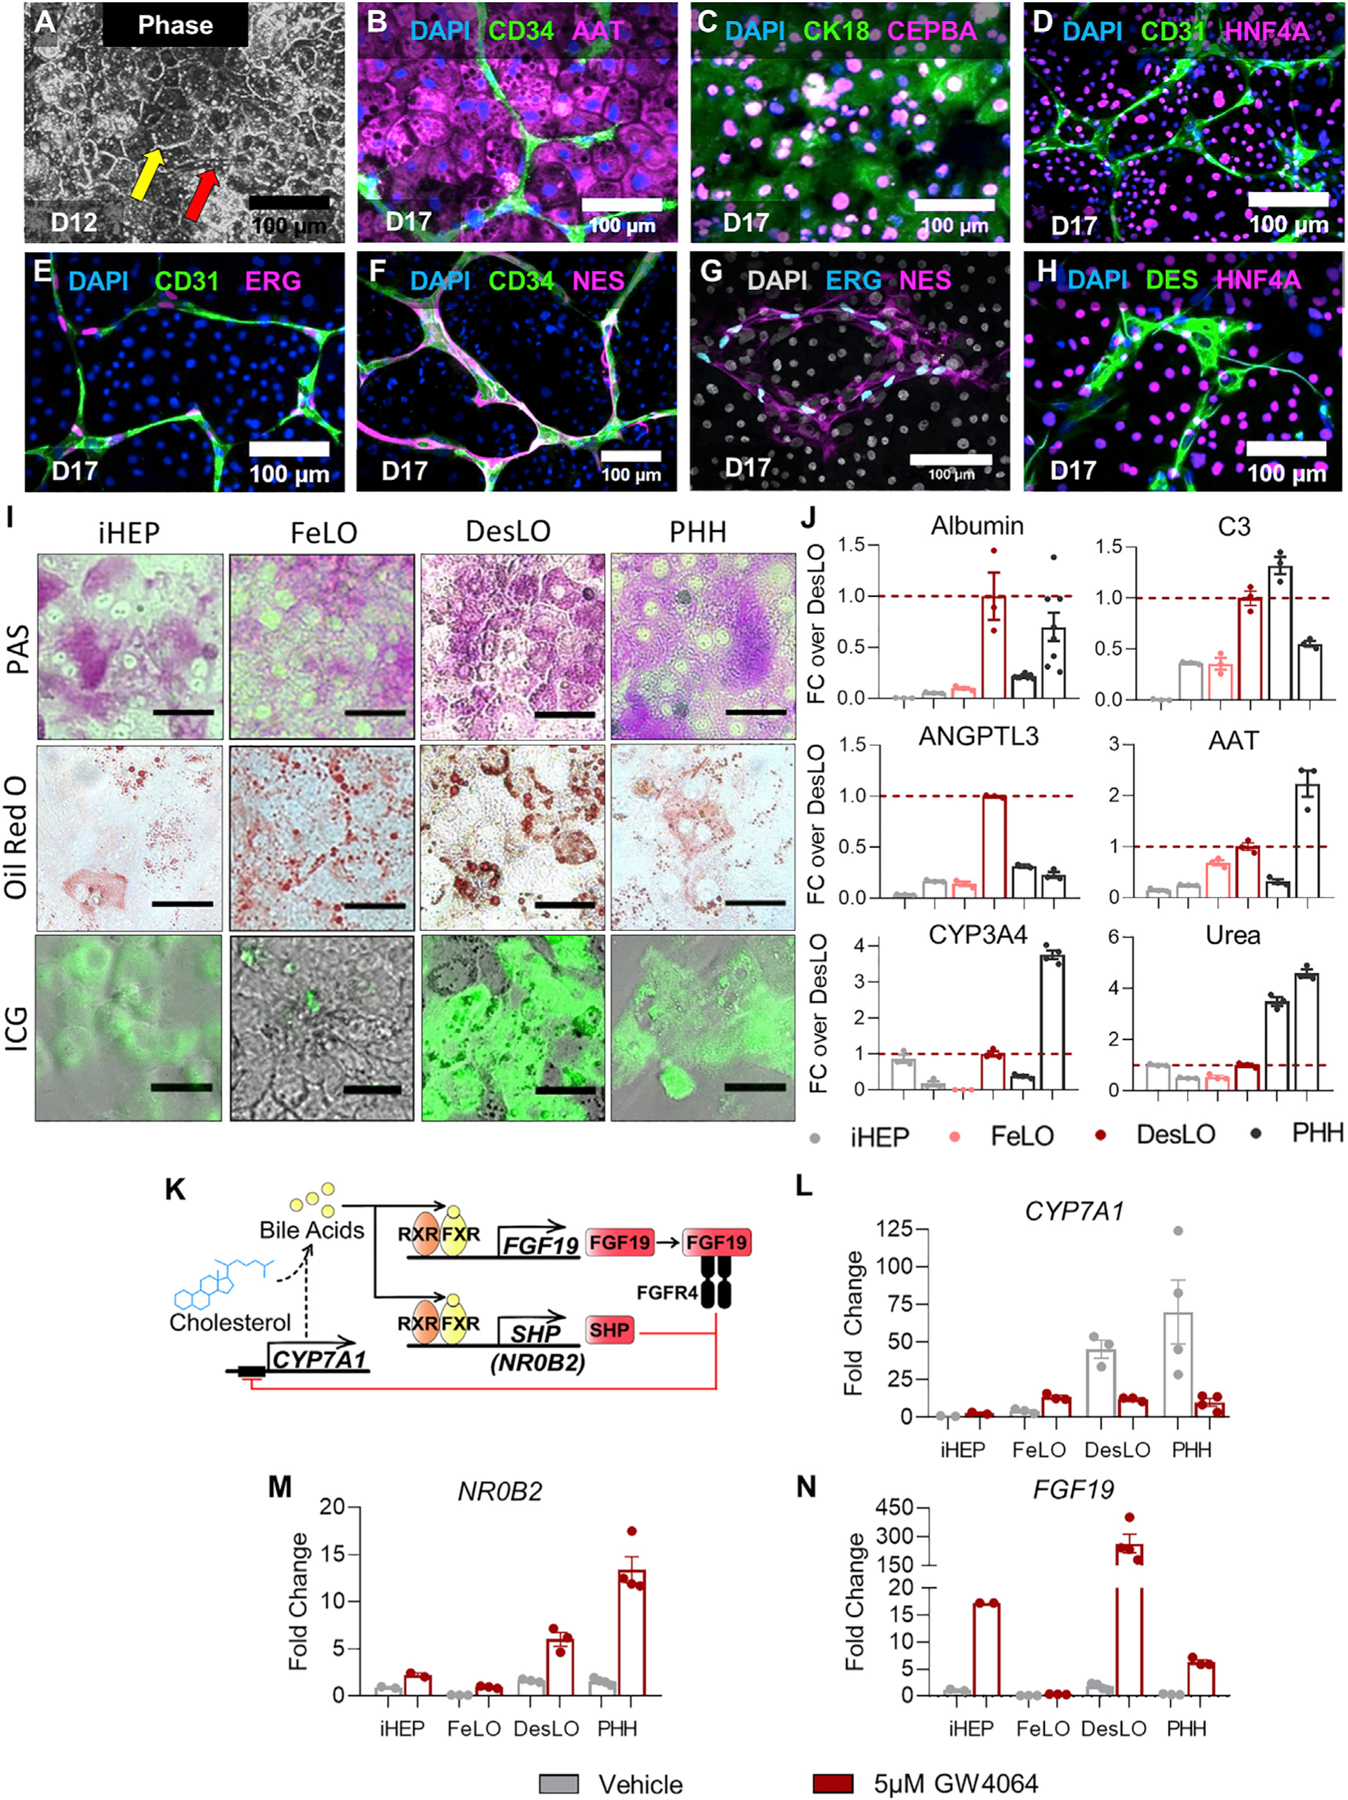
Figure 3. Immunofluorescence and Functional Comparison of DesLO, FeLO, iHEP, and PHH Cultures.

(A) Phase imaging of day 12 DesLO cultures shows the clear formation of tight junctions (indicated by the yellow arrow) characteristic of hepatic cells in culture and visible vascular structure (indicated by the red arrow) (D12: day 12). Scale bars, 100 µm.
(B–H) Immunofluorescence staining for DAPI with CD34 and AAT (B), CK18 and CEBPA (C), CD31 and HNF4A (D), CD31 and ERG (E), CD34 and NES (F), and DES and HNR4A (H) of day 17 DesLO cultures confirming the presence of HLC, SLC, and ELC populations through staining of cell-type indicative markers (D17: day 17). Scale bars, 100 µm.
(I) PAS, Oil Red O, and indocyanine green (ICG) stains indicating glycogen storage, lipid production, and solute transport activity, respectively, in iHEPs, FeLO, DesLO, and PHH cultures. Scale bar, 50 µm.
(J) ELISAs of liver-specific proteins, CYP3A4 enzymatic activity, and urea production measured in iHEP (2 lots, n = 3 each), FeLO (n = 3), DesLO, (n = 3), and PHH (2 lots, n = 3 except ANGPTL3 first lot is n = 2, and CYP3A4 second lot is n = 4). For albumin day <2 PHH samples (left PHH bar) is 2 lots, n = 3 each (n = 6 total) and day 3 PHH samples (right PHH bar) is 2 lots, n = 3 each (n = 6 total). All other PHH samples are <2 days in culture. Dotted line indicates DesLO average.
(K) Schematic of FXR regulation of CYP7A1 expression and bile acid synthesis.
(L–N) qPCR showing expression of CYP7A1 (L), NR0B2 (M), and FGF19 (N) in iHEP (n = 2), FeLO (n = 3), DesLO (n = 3), and PHH (2 lots, n = 2 each) vehicle controls and with addition of GW4064. Fold change is over iHEP vehicle.
Data are represented as mean ± SEM for (J) and (L–N).
See also Figure S3.
