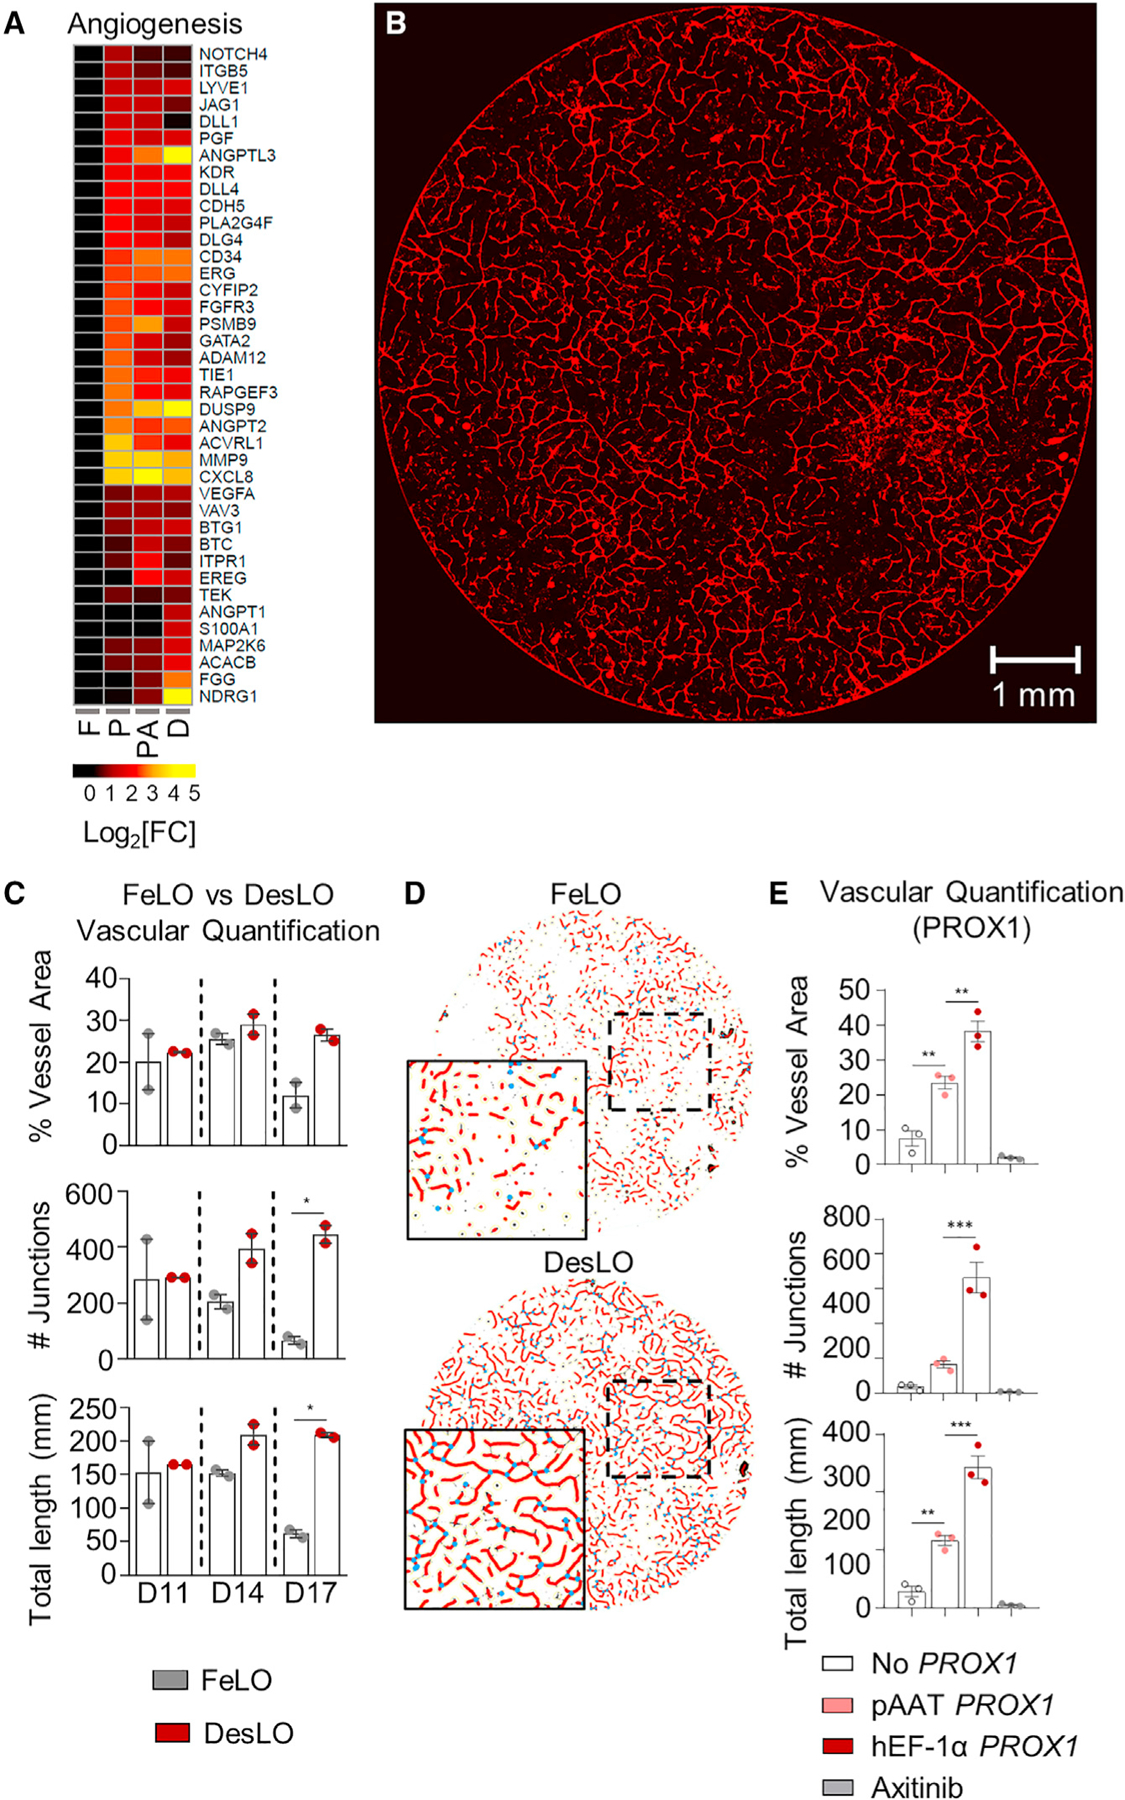
Figure 4. Vascular Development in DesLO.

(A) Heatmap showing the expression relative to FeLO of angiogenesis-related genes in FeLO (F), PROX1 (P), PROX1+ATF5 (PA), and DesLO (D) transduced at day 5 (except FeLO) in day 17 tissues. (n = 2, mean shown).
(B) Immunofluorescence staining for CD31 showing vascular network on day 17 DesLO tissue. Image of 8-mm diameter culture is shown. Scale bar, 1 mm.
(C) AngioTool analysis of vessel area, vascular junctions, and total vessel length based on CD31 immunofluorescence staining of DesLO and control FeLO. Significance relative to control FeLO for each time point. D11, D14, D14: day 11, 14, 17, respectively (n = 2). *p < 0.05 determined by one-way ANOVA with Tukey’s multiple comparison test.
(D) Image interpretation of immunofluorescence staining of day 17 control FeLO and DesLO for CD31 generated by AngioTool analysis shows a visual increase in vascular networks in DesLO.
(E) AngioTool analysis of vessel area, vascular junctions, and total vessel length based on CD31 immunofluorescence staining of DesLO without PROX1, with PROX1 driven by pAAT, and PROX1 driven by hEF-1α with or without axitinib (n = 3). **p < 0.01, ***p < 0.001 determined by one-way ANOVA with Tukey’s multiple comparison test.
Data are represented as mean ± SEM for (C and E).
See also Figure S4.
