
Figure 5. Comparison with Previously Developed Organoids and scRNA-Seq Analysis of DesLO.
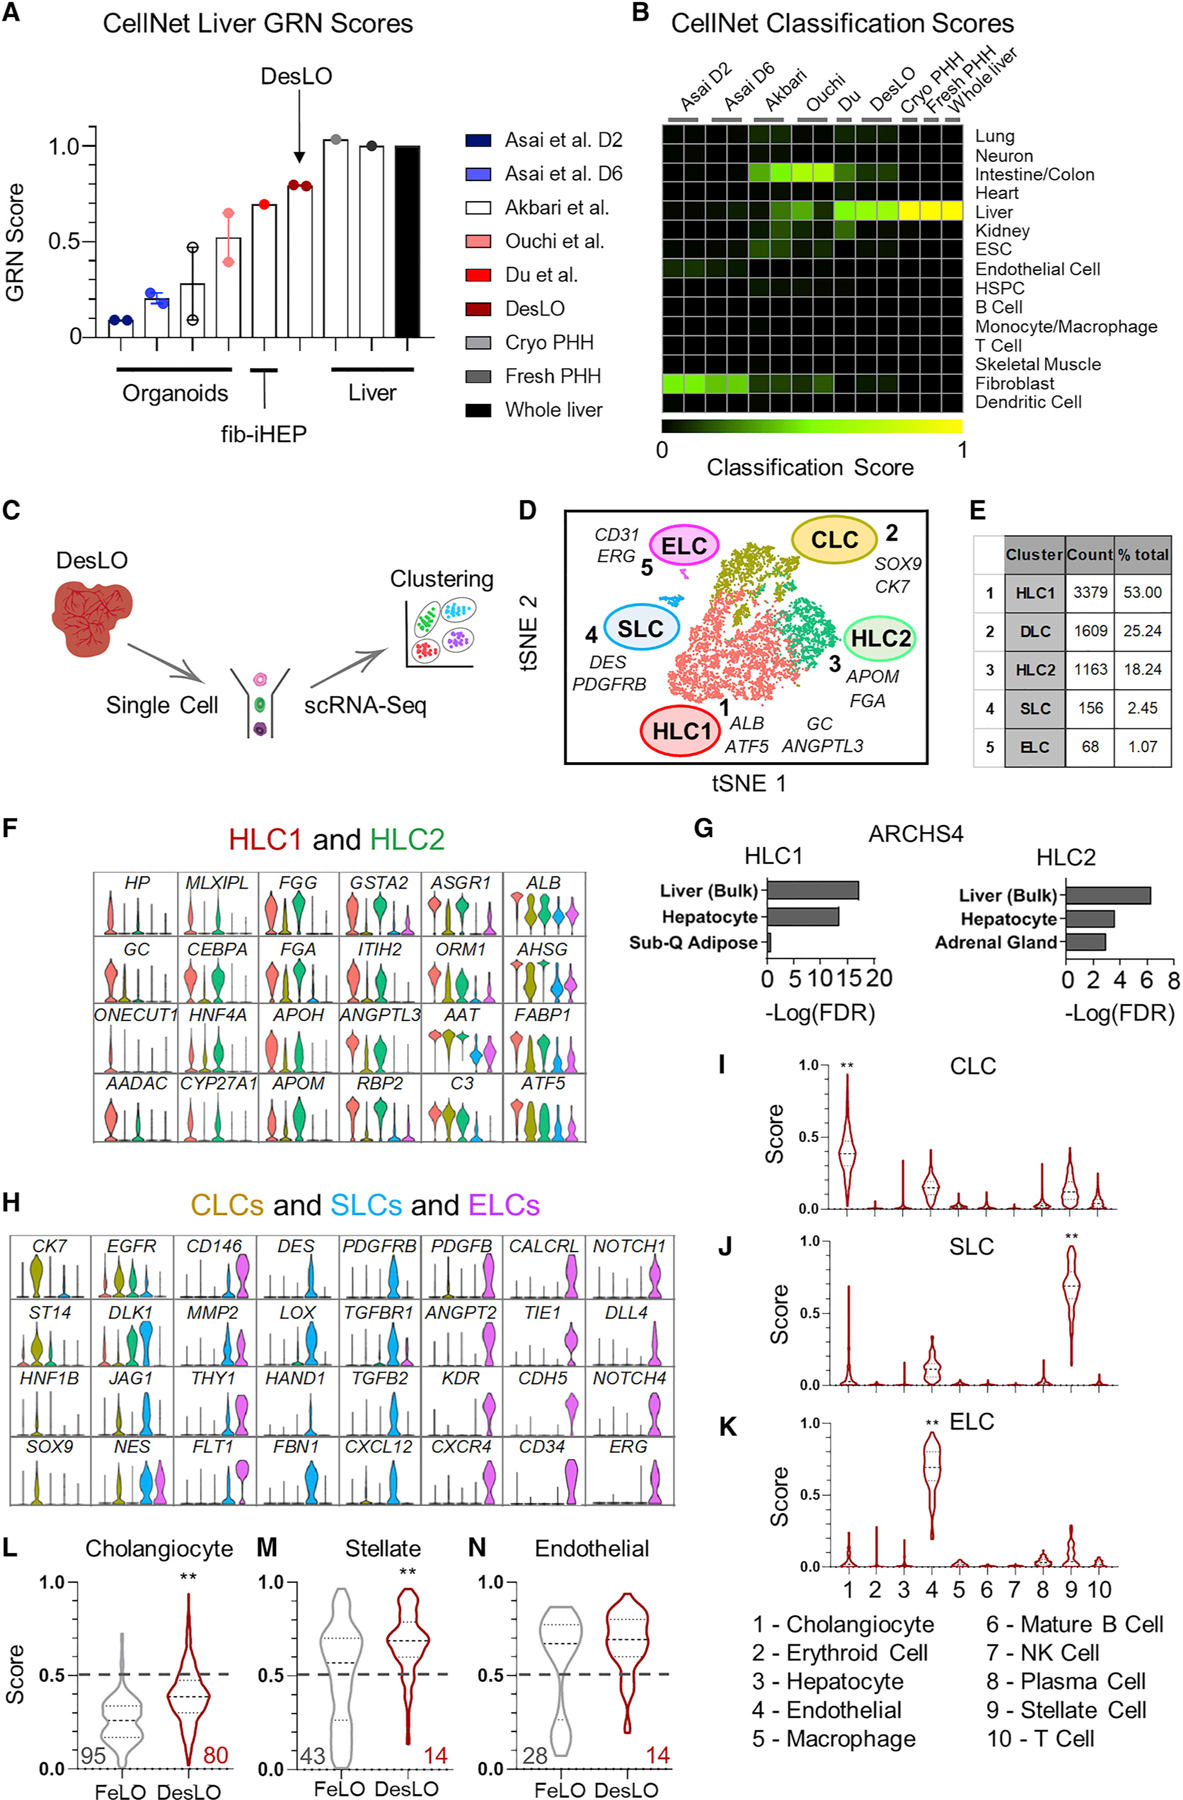
(A) CellNet meta-analysis of organoids showing GRN scores for liver organoids from hiPSCs, fibroblast-derived induced hepatocytes (fib-iHEP), cryopreserved primary human hepatocytes (Cryo PHH), freshly isolated primary human hepatocytes (Fresh PHH), and whole liver tissue. All samples are n = 2 except for Du et al, Fresh PHH, Cryo PHH, and Whole liver samples, which are n = 1.
(B) CellNet meta-analysis of organoids showing classification scores determined for selected previously reported liver organoids from hiPSCs, fib-iHEP, Cryo PHH, Fresh PHH, and whole liver tissue.
(C) Schematic of single-cell analysis for the organoids.
(D) t-distributed Stochastic Neighbor Embedding (tSNE) plot of scRNA-seq data analyzed using Seurat. Cluster numbers, names, and examples of enriched genes are displayed. HLC, hepatocyte-like cells; SLC, stellate-like cells; ELC, endothelial-like cells; CLC, cholangiocyte-like cells.
(E) Table showing the number of cells and percentage of the total population in each DesLO cluster.
(F) Violin plots showing hepatocyte associated genes upregulated in HLC clusters
(G) Enrichr analysis genes upregulated in HLC1 and HLC2 clusters against the ARCHS4 tissue library.
(H) Cholangiocyte-enriched genes upregulated in CLC, stellate-specific genes upregulated in SLC, and endothelial-specific genes upregulated in ELC clusters.
(I–K) Single-Cell net analysis of CLC (I), SLC (J), and ELC (K) clusters against a training set generated from human liver cells. **p < 0.0002 by KruskalWallis multiple comparison test.
(L-N) Comparison of classification scores between FeLO and DesLO for cholangiocyte (L), stellate cell (M), and endothelial cell (N) identities. The percentage of cells with classification scores below 0.5 are shown in gray for FeLO and red for DesLO. **p < 0.0001 by Mann-Whitney test
Data are represented as mean ± SEM for (A).
See also Figure S5.