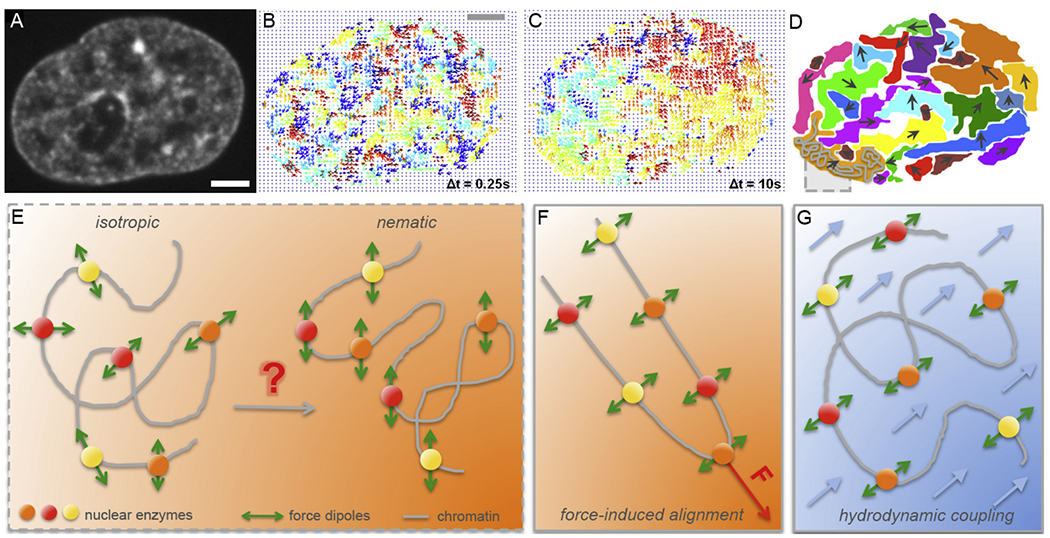
Figure 2:

Micron-scale coherence of interphase chromatin. (A-D) Mapping of interphase chromatin dynamics using Displacement Correlation Spectroscopy (DCS) [44]: (A) A fluorescent micrograph of chromatin visualized by histones H2B-GFP in a live HeLa cell nucleus. (B) DCS map of chromatin displacements displayed as vectors (arrows) for Δt = 0.25 s. The displacement vectors are color-coded by their direction, i.e., the vectors of the same color correspond to a motion in the same direction. Note, chromatin motion at timescale of Δt = 0.25 s is uncorrelated. (C) DCS map of chromatin displacements for Δt = 10 s. Chromatin motion shows regions, where chromatin displacement vectors are correlated, i.e., chromatin motion is coherent in those regions at timescale of Δt = 10 s. (D) Cartoon highlighting the observed regions of coherency in (C). A grey box highlighting a chromatin fiber (grey) inside a coherent region (orange). (E) Schematics illustrating nuclear enzymes acting on chromatin fiber as force dipoles. In an isotropic state force dipoles are pointing into random directions, whereas in a nematic state force dipoles are ordered in parallel and can lead to coherent chromatin motion over large length scales. (F-G) Two hypotheses of inducing a local nematic order of force dipoles: (F) force-induced alignment by a local action of a transient force, and (G) hydrodynamic coupling, i.e. fluid-mediated interactions between force dipoles (fluid in blue, fluid flows indicated by blue arrows). (A-C) Adapted from [44]. Scale bar, 2 μm.
