
Figure 2.
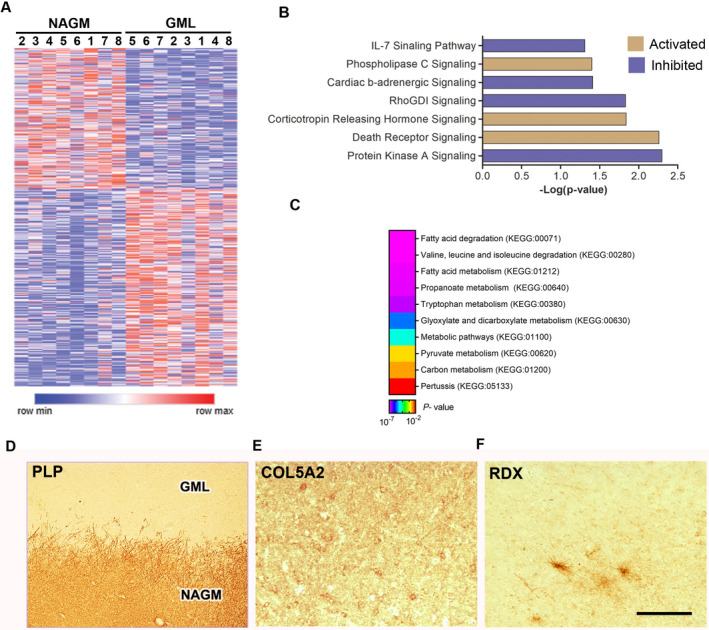
Gene expression profiling of GMLs from progressive MS brain. (A) Heatmap showing DEGs of NAGM and GML tissues from progressive MS brain (n = 8). (B) IPA analysis of GML DEGs (p < 0.05) showing enriched canonical pathway based upon z‐scores (orange—positive; purple—negative). (C) Representative heatmap image showing KEGG pathways associated with significantly dysregulated GML DEGs from progressive MS brains. (D–F) IHC images showing PLP, COL5A2, and RDX immunostaining in a demyelinated GML and surrounding NAGM from a progressive MS brain tissue. Scale bar—100 µm.