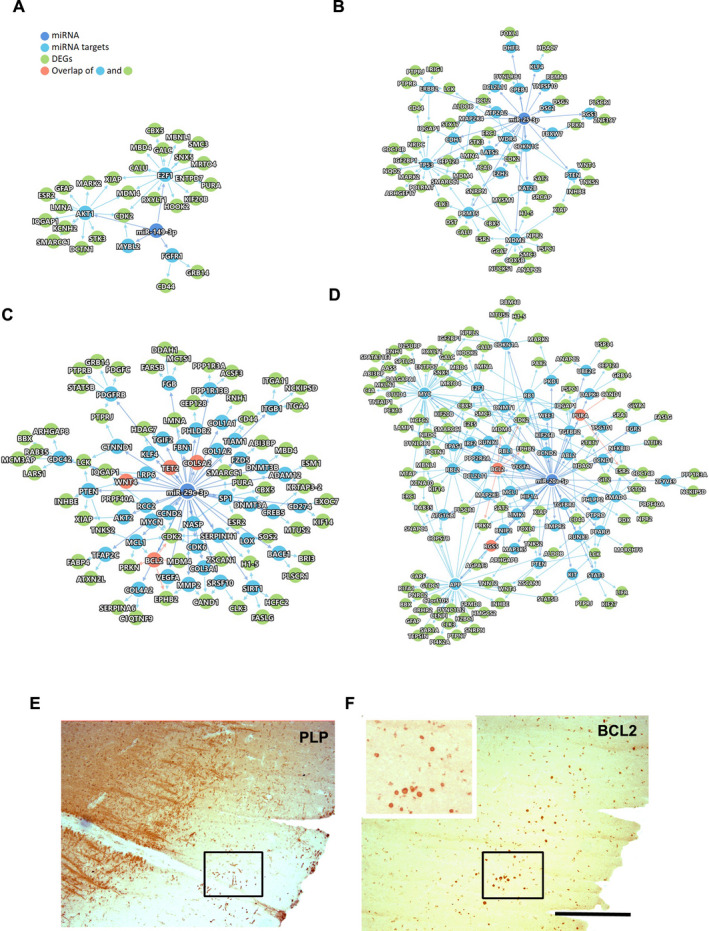
Figure 3.

The protein–protein interactions of atrophy‐associated miRNAs (blue) and predicted/confirmed targets genes (blue/green/orange). (A) miR‐149*, (B) miR‐25, (C) hsa‐miR‐29c, and (D) hsa‐miR‐20a and the DEGs from the list of GML gene expression data. Direct miRNA targets are shown in blue circles. Proteins in orange circles represent both DEGs and miRNA direct targets. (E, F) Representative IHC images of PLP and BCL2 immunostaining in a demyelinated GML and surrounding NAGM from a progressive MS brain. Left upper boxed area highlights selected region showing increased BCL2‐positive cells in GML. Scale bar—100 µm.
