
Figure 1.
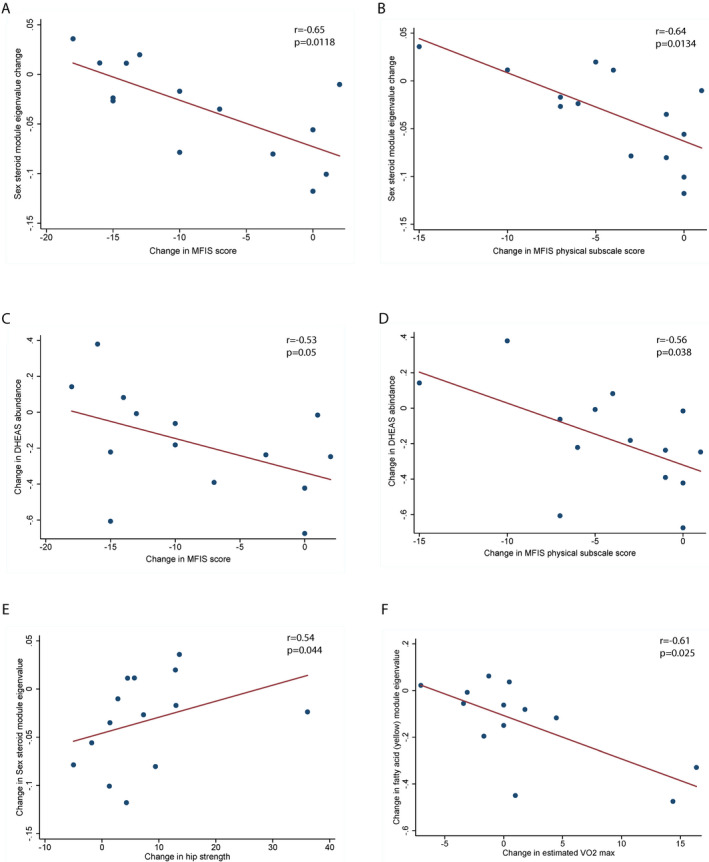
Relationship between change in the metabolome and clinical measures in pwMS. (A) Scatter plot depicting a strong inverse relationship between change in sex steroid metabolite module eigenvalue and fatigue (MFIS) scores. (B) Scatter plot depicting a strong inverse relationship between change in sex steroid metabolite module eigenvalue and score on the physical subscale of MFIS. (C) Scatter plot depicting a strong inverse relationship between change in DHEAS abundance and fatigue (MFIS) scores. (D) Scatter plot depicting a strong inverse relationship between change in DHEAS abundance and score on the physical subscale of MFIS. (E) Scatter plot depicting the moderate correlation between change in sex steroid metabolite module eigenvalue and hip strength. (F) Scatter plot depicting a strong inverse relationship between change in fatty acid metabolism module eigenvalue and cardiovascular fitness (measured by estimated VO2 max). p and r values for A–F are derived from Spearman’s correlations.