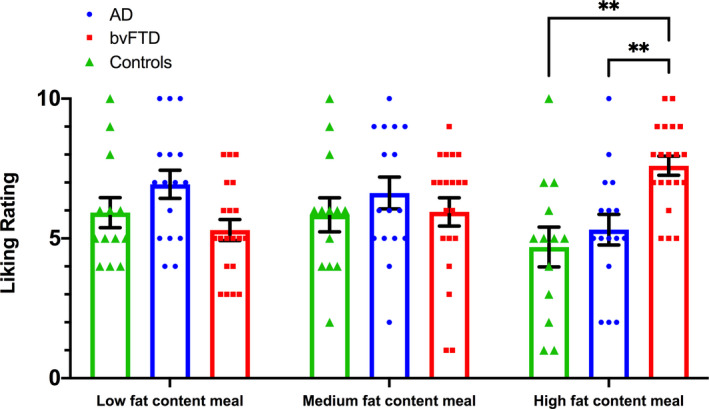
Figure 2.

Bar plots depicting liking rating of each meal. Each dot represents each individual data point; error bars represent standard error of the mean (SEM). AD, Alzheimer’s disease; bvFTD, behavioural‐variant frontotemporal dementia. **p ≤ 0.001 compared to both AD and controls.
