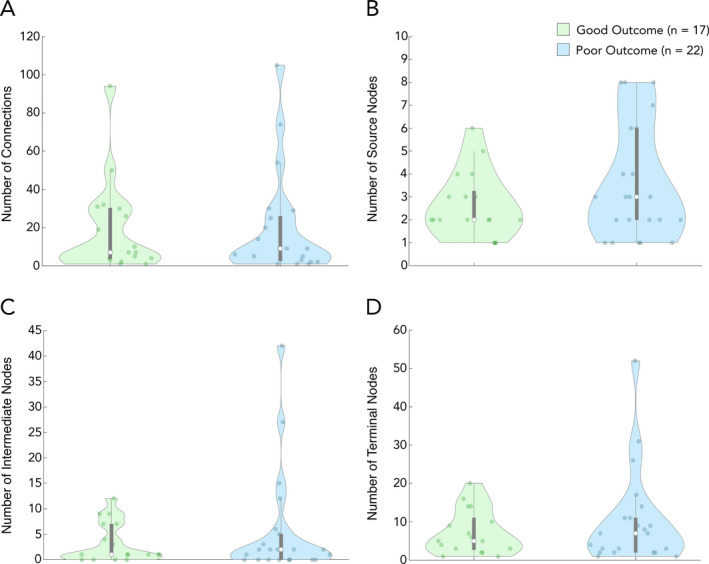
Figure 3.

Propagation network characteristics. Characteristic features of epileptic networks. (A) Mean number of significant channel pairs, denoting a pathway of propagation; there was no significant difference between the good and poor outcome groups (p = 0.955). (B) Mean number of source nodes; patients in the good outcome group had significantly fewer source nodes than patients in the poor outcome group (p = 0.423). (C) Mean number of intermediate nodes; there was no significant difference between patients in the good and poor outcome groups (p = 0.897). (D) Mean number of terminal nodes; there was no significant difference between patients in the good and poor outcome groups (p = 0.776). Data shown is from the first 1‐h epoch for all patients. Each white dot represents group median, and gray bars represent interquartile range
