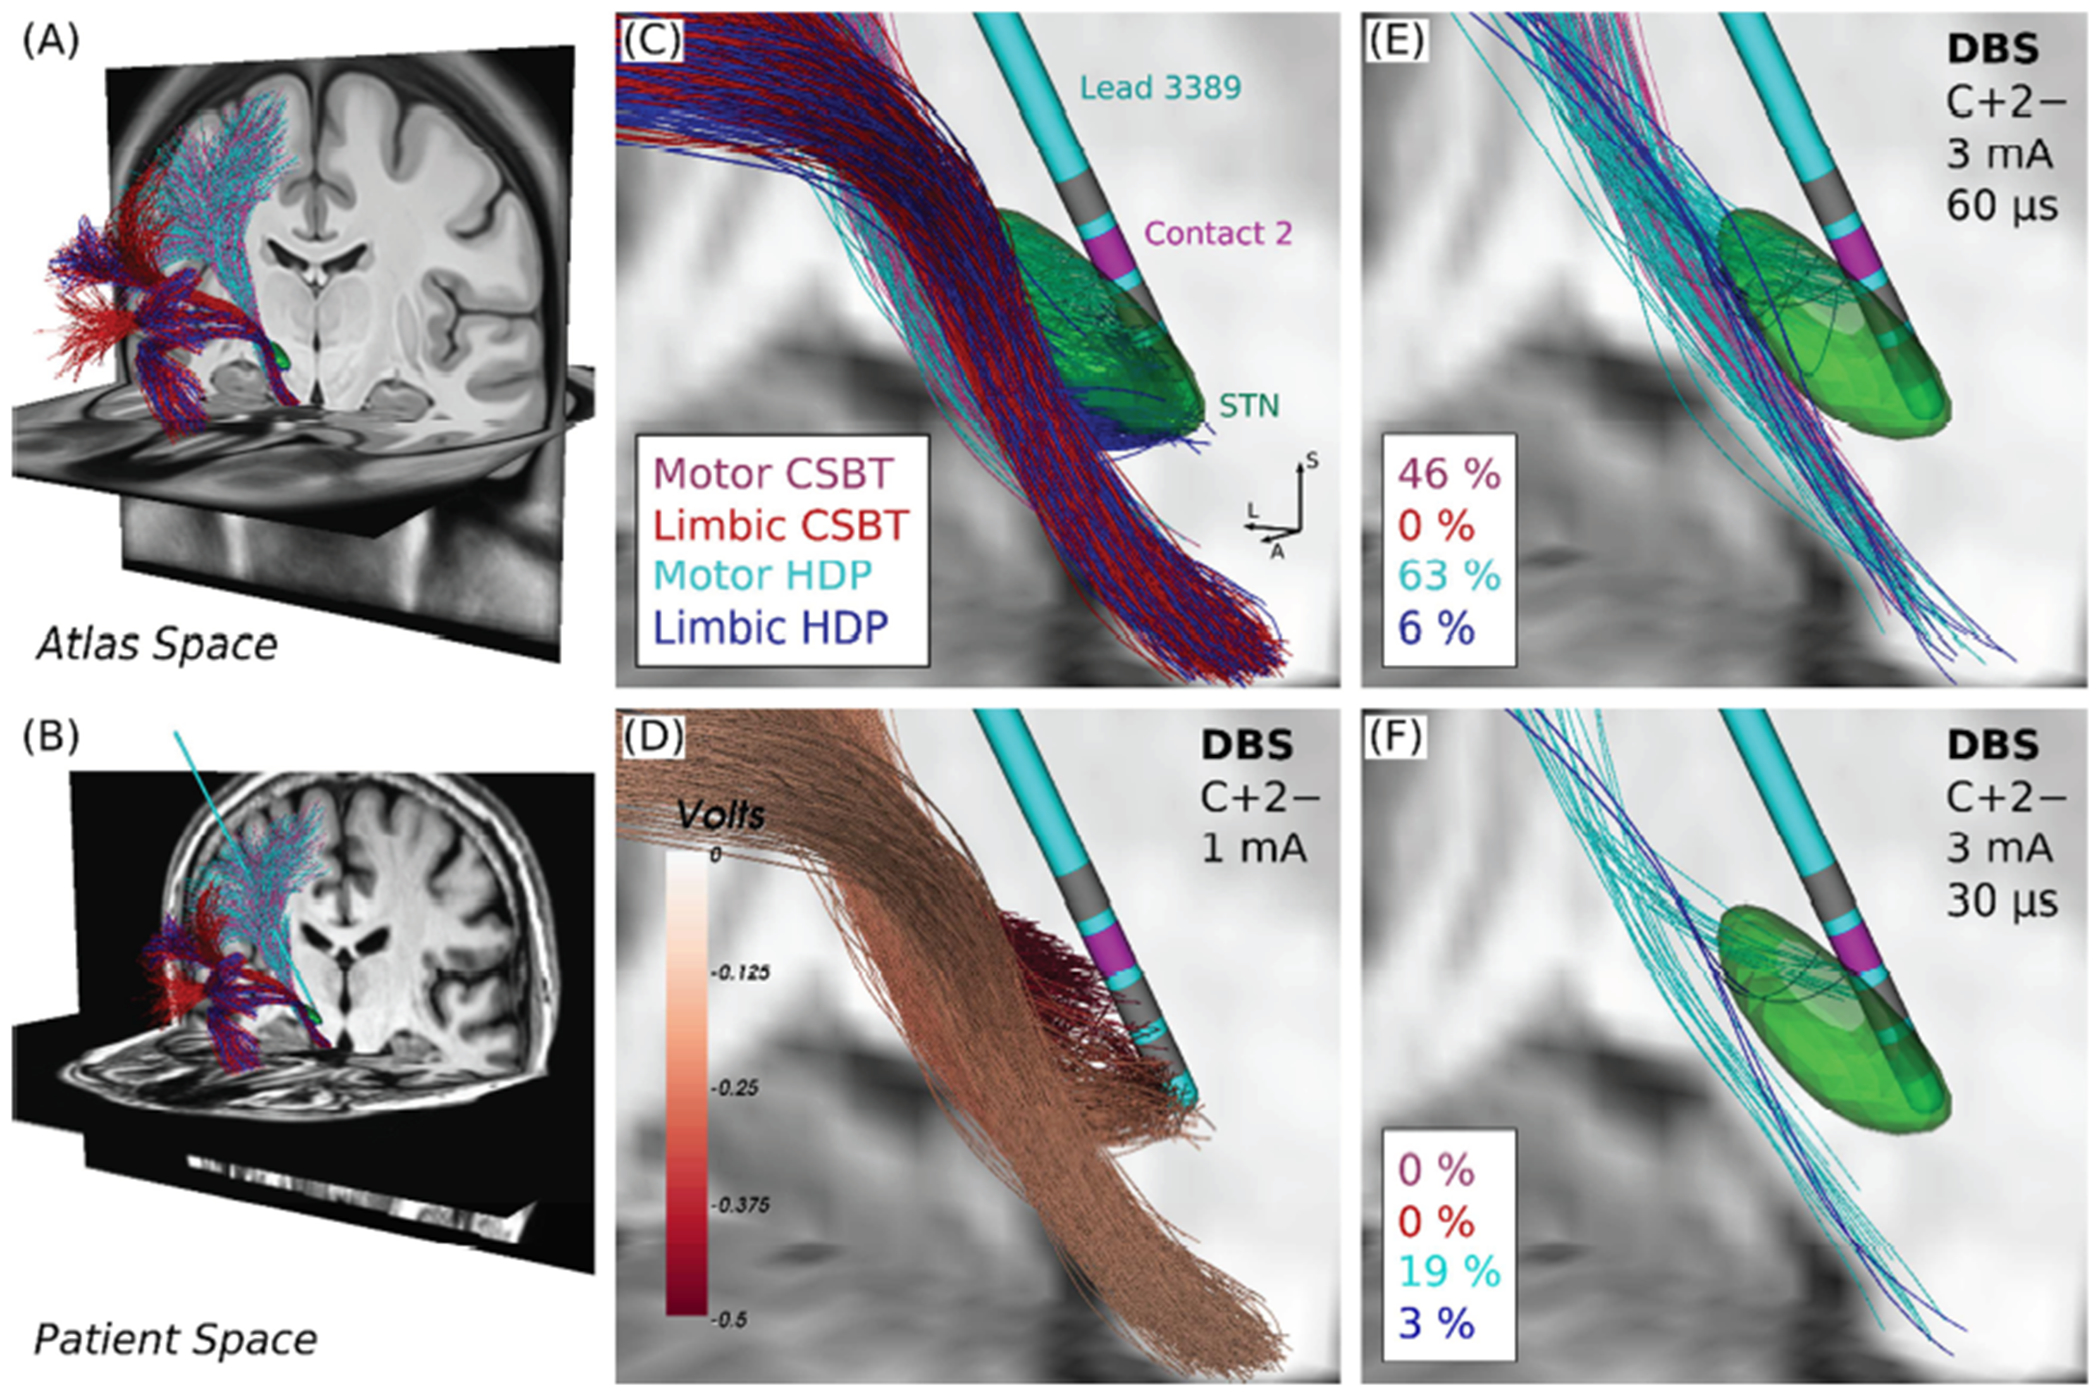
Figure 1. Individualized connectomic estimates of direct axonal activation.

(A) Anatomical models of corticospinal/bulbar tract (CSBT, reds) and hyperdirect pathway (HDP, blues) with the subthalamic nucleus (STN, green) overlaid. (B) Pathways warped into Patient 3’s preoperative T1w space with their lead overlaid. (C) Closeup of Panel B. Directions: L = lateral, S = superior, A = anterior. (D) Extracellular voltages applied to the pathways from a 1 mA of current applied between an active cathodic contact (2−, magenta) and a distal large return electrode on the contralateral shoulder (C+, not shown). Examples of (E) percent co-activation of CSBT and HDP, and (F) selective activation of HDP at 10 Hz.
