
Figure 2. Electrocorticographical evaluation of direct axonal activation.
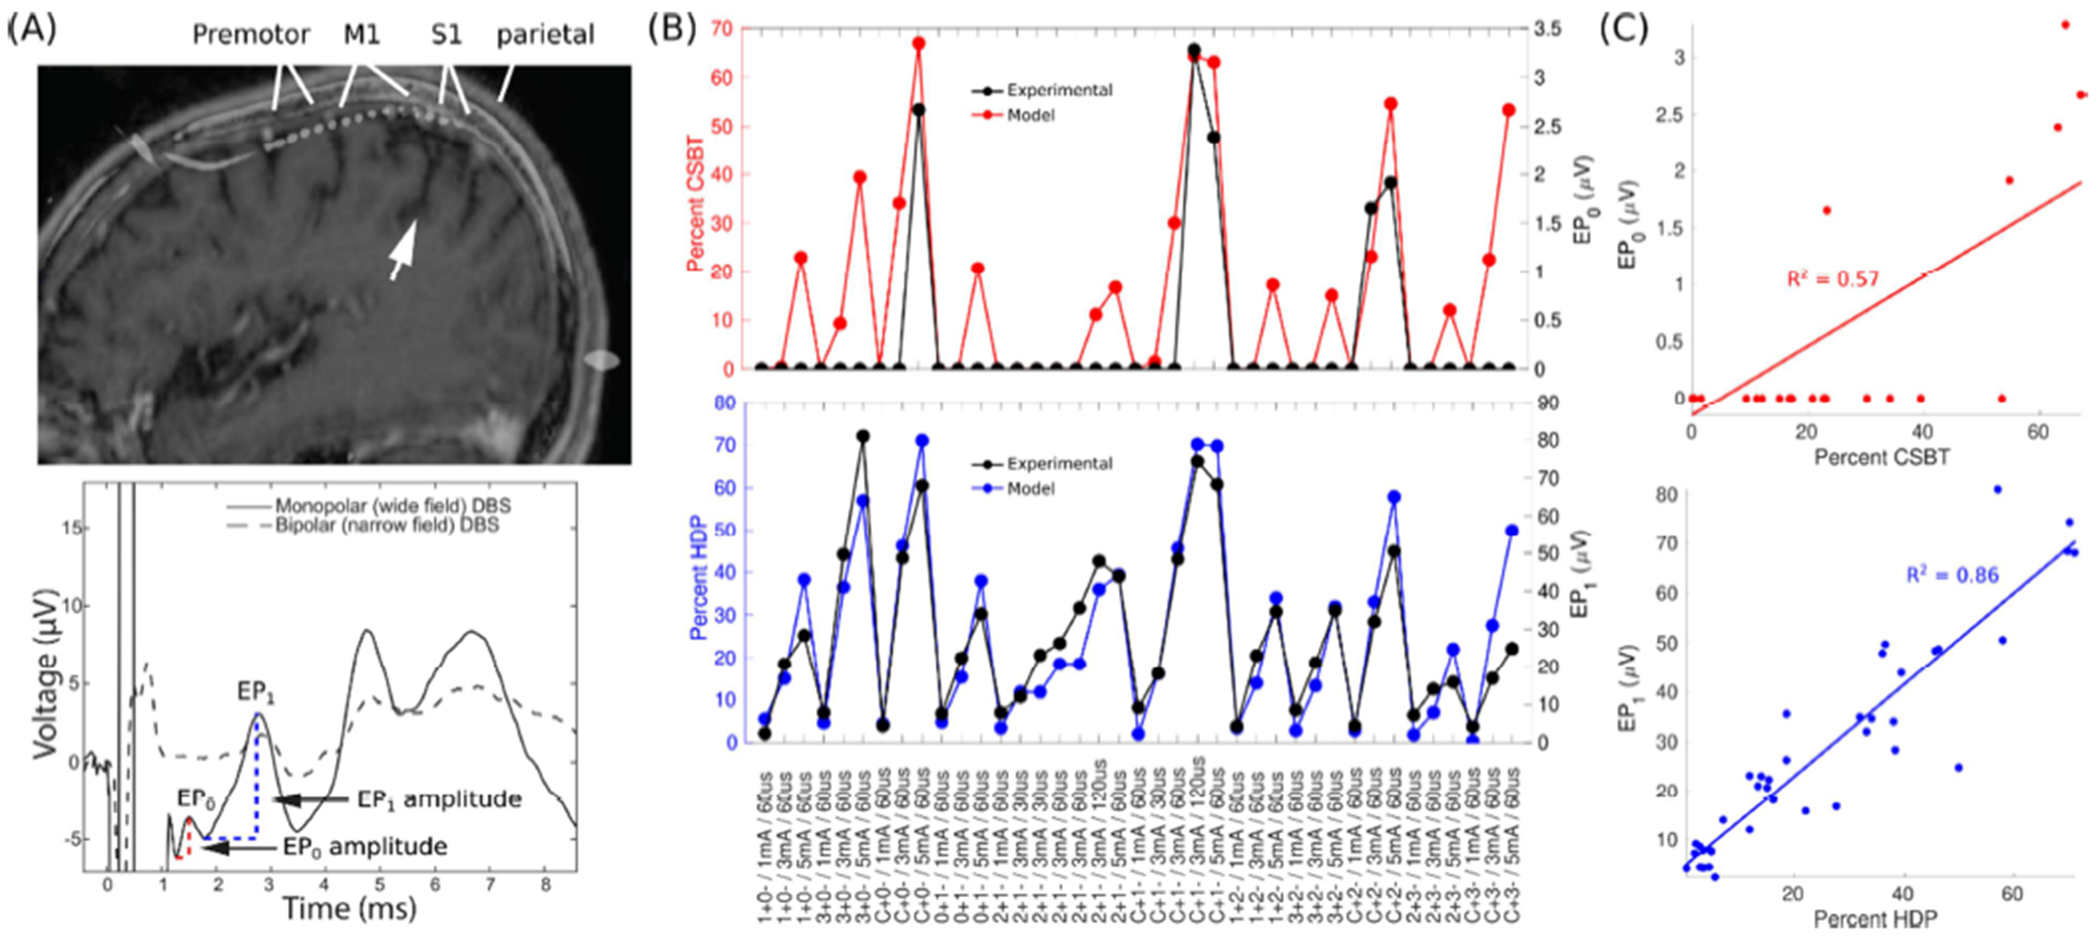
(A) Evoked potentials (EPs) recorded with subdural electrocorticography (ECoG) during subthalamic deep brain stimulation (DBS). The electrode strip spanned the premotor cortex, primary motor cortex (M1), primary sensory cortex (S1), and superior parietal lobule. White arrow points at the central sulcus. The bottom panel depicts an averaged EP trace for monopolar and bipolar electrode configurations, demonstrating that EPs are distinct from the stimulation artifact. EP0 and EP1 peaks are denoted. (B) EP0 amplitude was correlated with modeled activation of the corticospinal/bulbar tract (CSBT, red) and EP1 amplitude with the hyperdirect pathway (HDP, blue). Data from Patient 3. (C) Linear correlations between the EPs and the model pathway activation from Panel B. R2 = Coefficient of Determination. Stimulation settings: IDs of anode (+) and cathode (−) / current amplitude / stimulus pulse width. Contact 0 is nearest to the tip of Medtronic Lead 3389.