
Figure 7. Patient-specificity was necessary for good model performance.
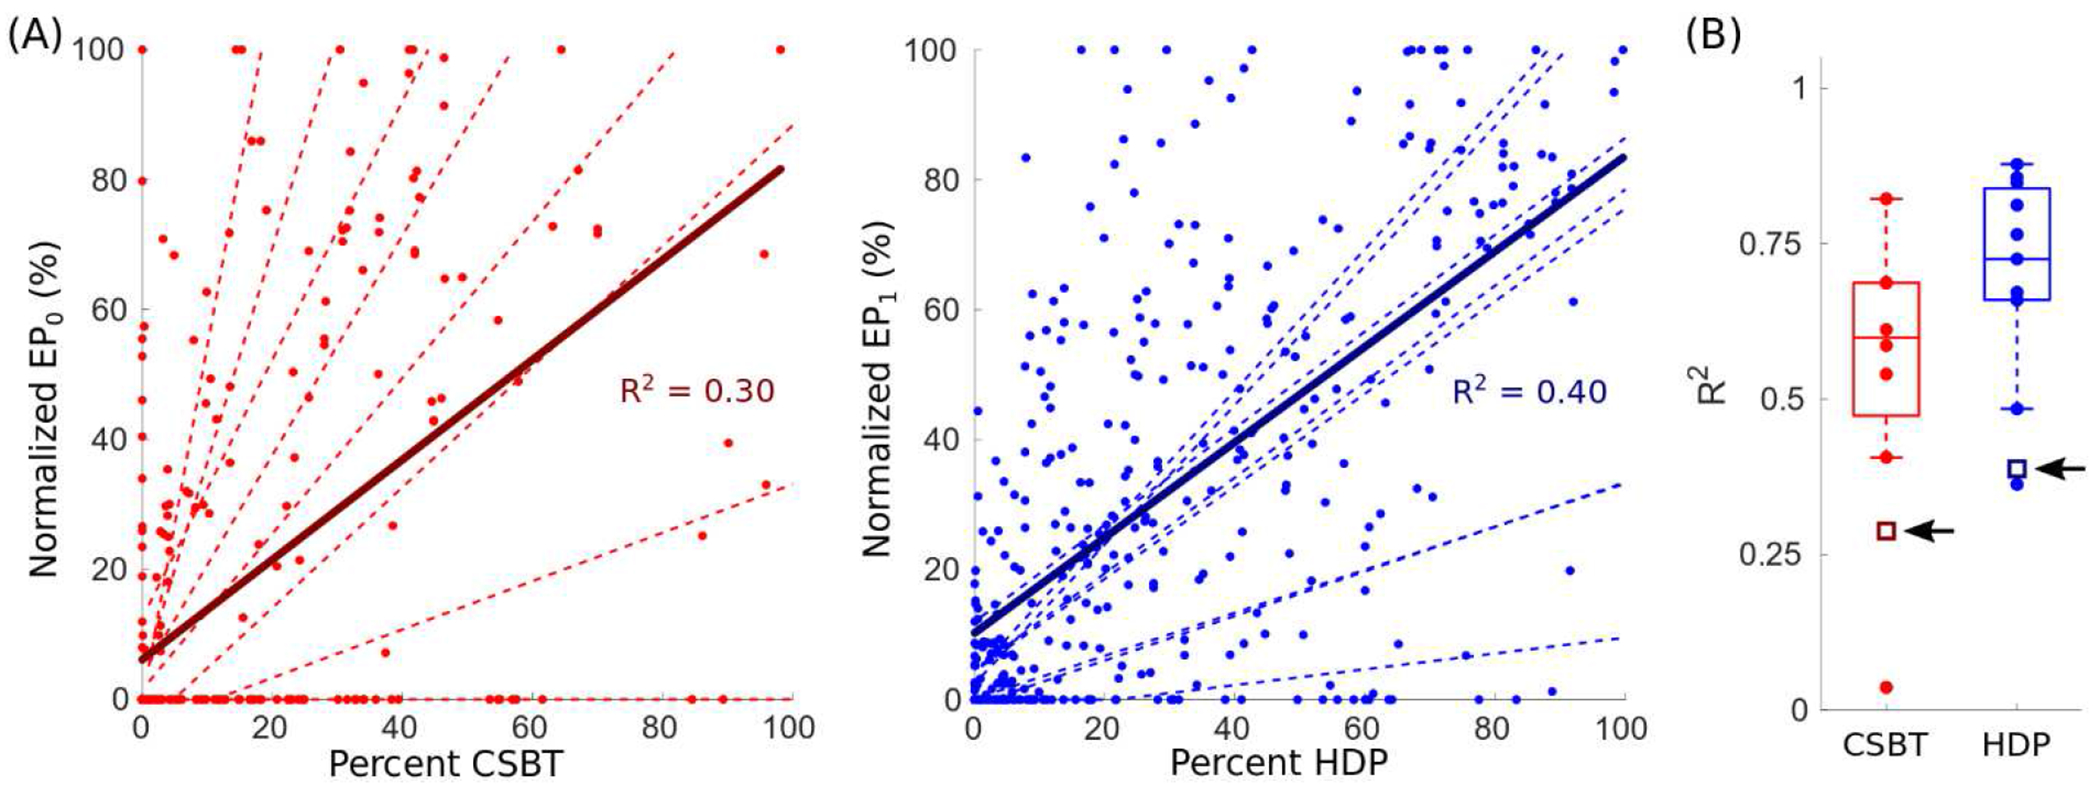
(A) Linear correlations between the normalized evoked potential (EP) amplitudes and their respective pathway activations aggregated across the entire cohort, where EP0 (reds) and EP1 (blues) were normalized by the respective range of amplitudes in each patient (i.e., (value – minimum value) / range of values) and expressed as a percentage. For comparison, the distribution of individual linear regression fits (dashed lines) for all patients are shown. R2 = coefficient of determination, CSBT = corticospinal/bulbar tract (n = 8, left), and HDP = hyperdirect pathway (n = 11, right). (B) R2 for aggregate fits (open squares) compared to respective patient-specific fits (filled circles). The black arrows point to the respective R2 for aggregate fits.