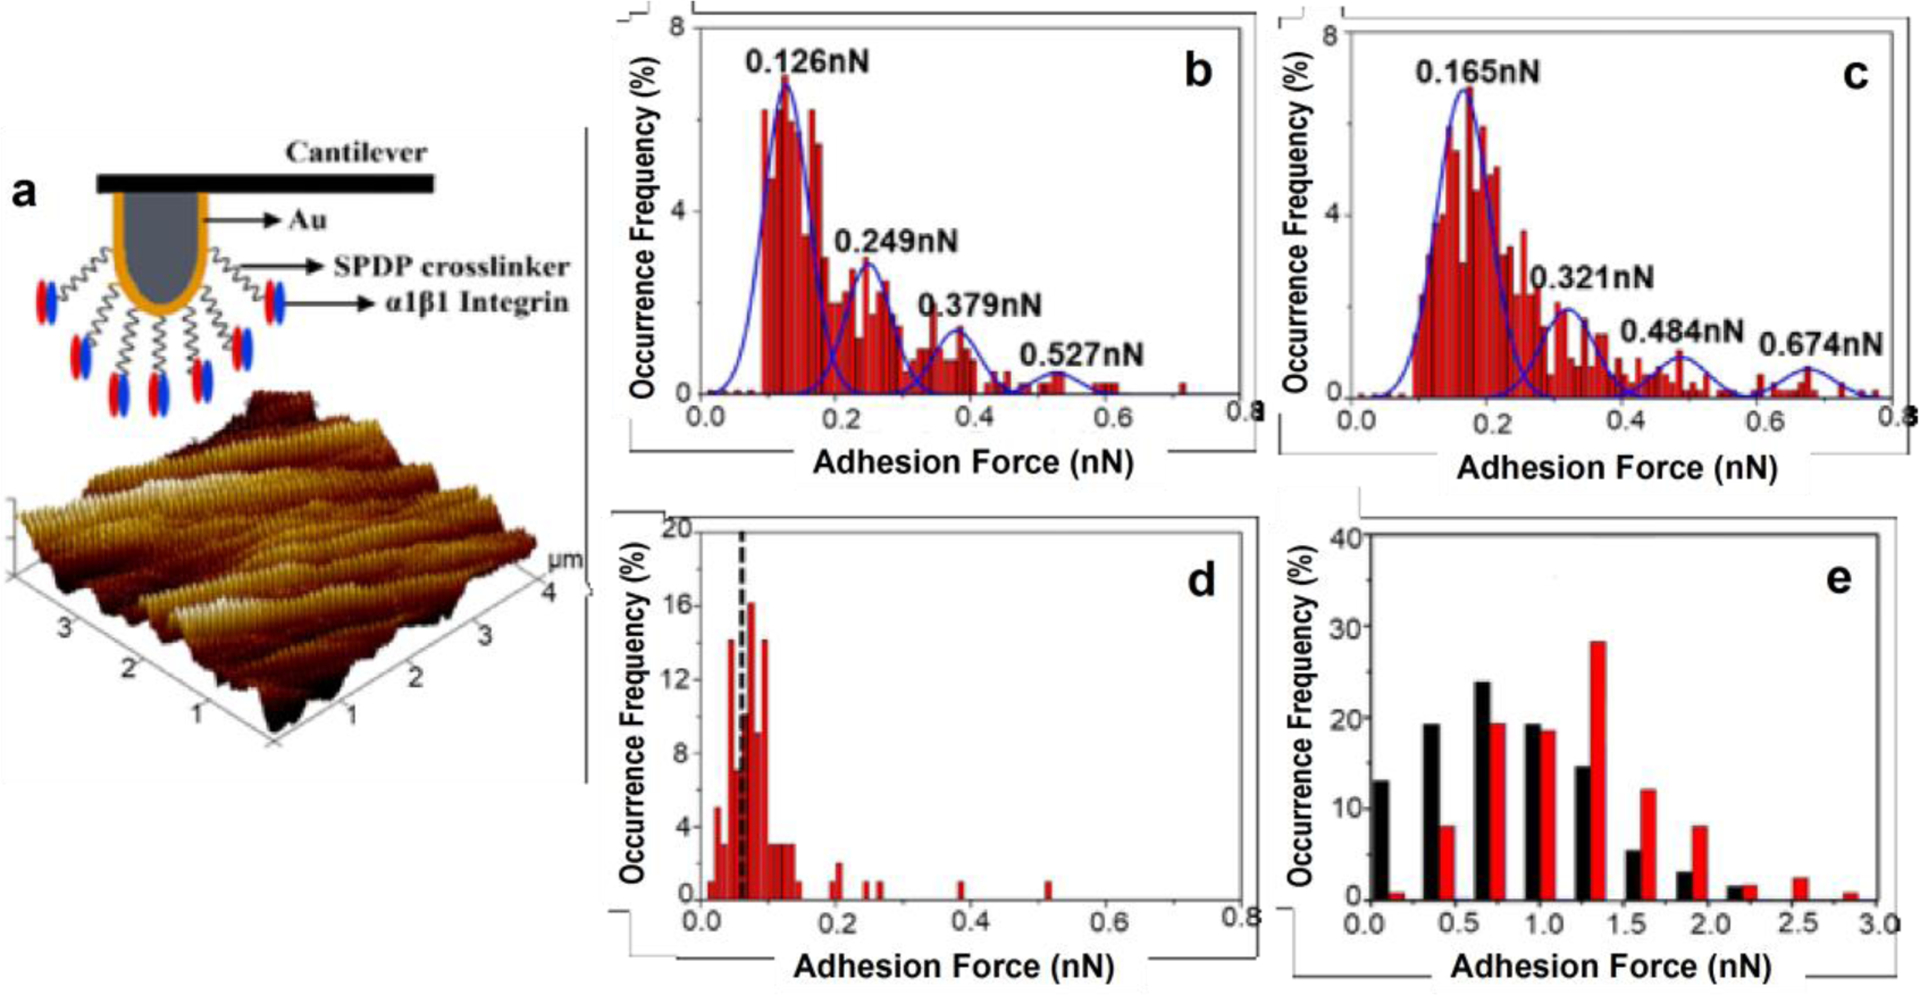
Figure 2.

Binding force measurements on various matrices. (a) Functionalization of α1β1-integrin on an AFM probe to measure its binding force to a collagen matrix. (b–d) Histograms showing the distribution of binding forces measured between α1β1-integrin and COLI (b), COLIII (c) or a control BSA coated surface (d). Gaussian fitting peaks are shown in (b,c). (e) Histograms showing the distribution of adhesion forces measured between a whole cell and a COLI (black) or COLIII (red) matrix.
