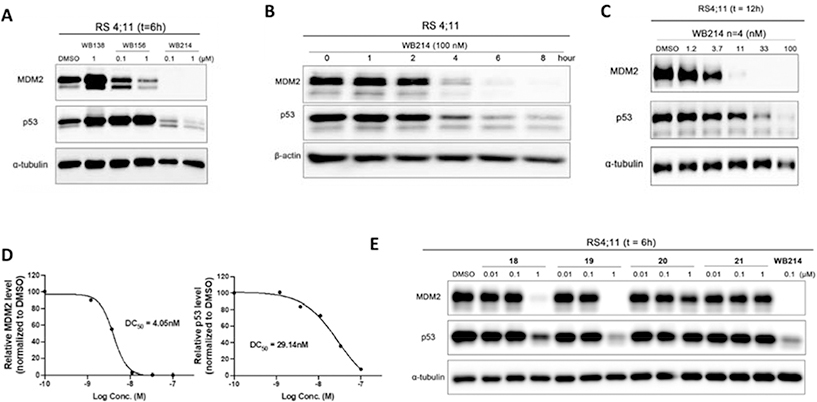
Figure 2.
Western blot profiling of degradation in RS4;11 leukemia cells. (A) Immunoblot of MDM2 and p53 following treatment of cells with DMSO or indicated compounds for 6 h; (B) Immunoblot of MDM2, p53 following incubation with 100 nM WB214 for indicated times; (C) Immunoblot of MDM2 and p53 following 12 h incubation with DMSO or the indicated concentrations of WB214; (D) Band intensity quantification of blot C calculated by Image J, and bar graph plotted and fitted by GraphPad Prism; E) Immunoblot of MDM2 and p53 following treatment with DMSO or indicated compounds for 6 h.

