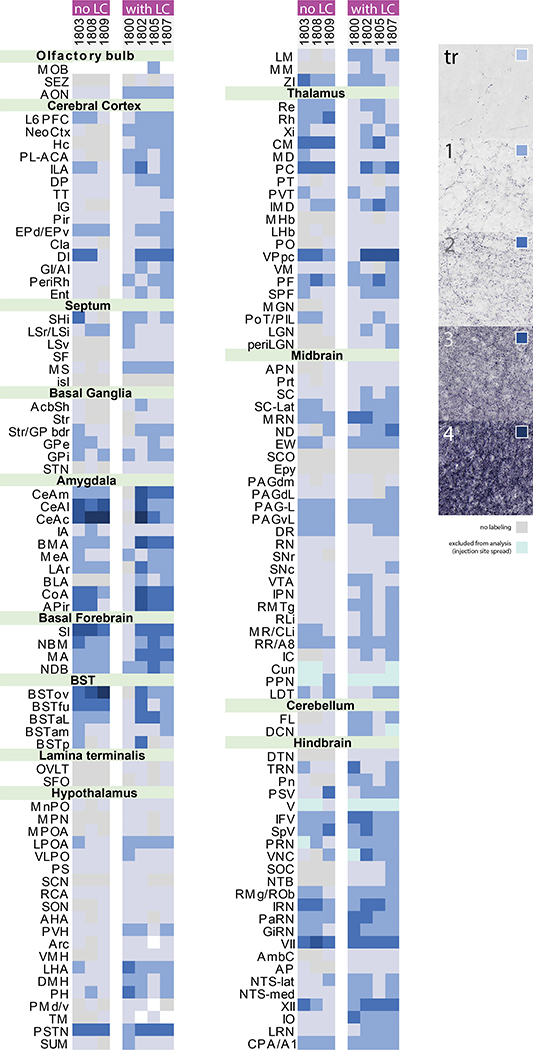
Figure 11.
Density of Syp-mCherry-labeled boutons across 147 brain regions in each case. Cases are divided into two groups based on the presence or absence of Syp-mCherry expression in LC neurons. Semi-quantitative density standards used to rate each region are shown in the legend at right. Light gray indicates an absence of labeling. Light-to-dark shades of blue represent increasing densities. Ice blue represents regions excluded from analysis due to Syp-mCherry expression in cell bodies and/or dendrites near the injection site. White represents areas that could not be analyzed due to histologic artifacts. Abbreviation: tr, trace labeling.

