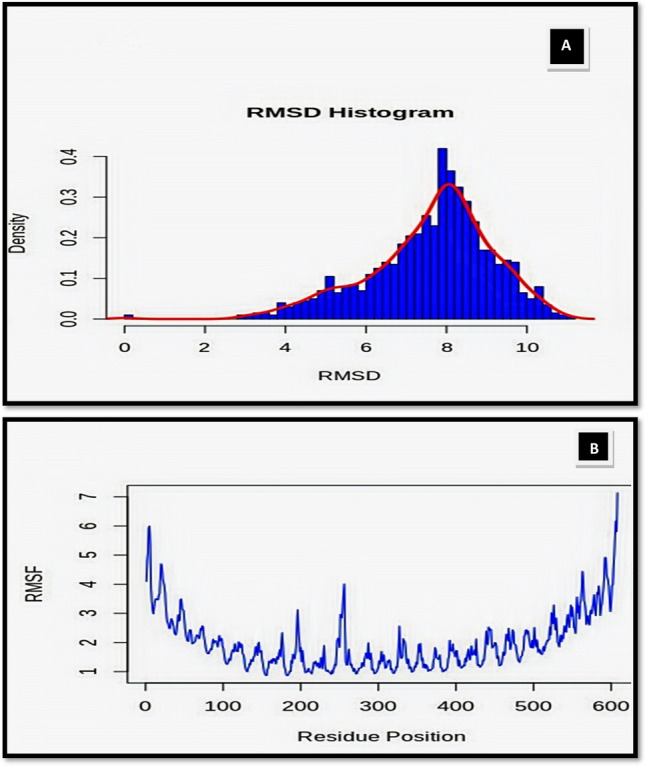
Fig. 7.

Molecular simulation analysis of docked complex: A the RMSD density distribution histogram for the docked complex TLR5 and vaccine adjuvant are shown. B The RMSF plots of the docked complex TLR5 and vaccine adjuvant are shown. Least RMS fluctuation can be seen in these interface residues, that acts as indicator of vaccine interactional stability
