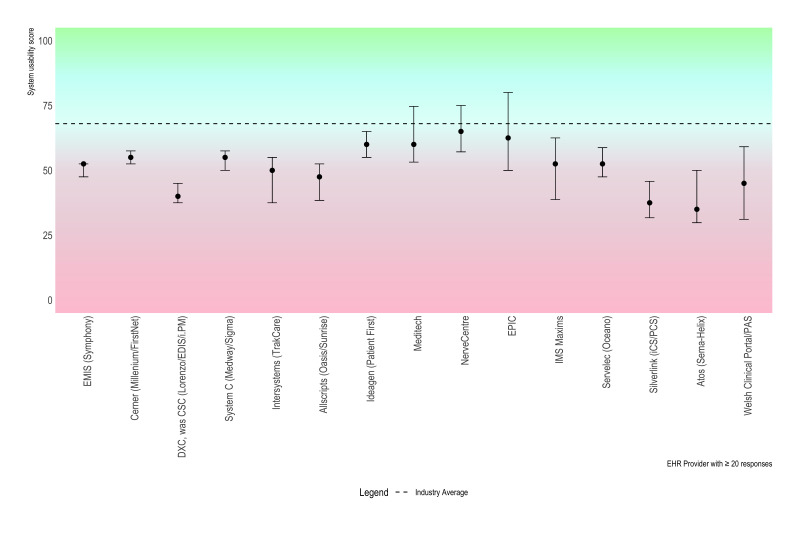
Figure 3.
Point and whisker plot of median SUS by EHR provider. Whisker is 95% CI. EHRs are ordered from most to least responses (left to right). Dashed line is the average across industries and products, and constitutes low margin of acceptability. EHR, electronic health record; SUS, System Usability Score.

