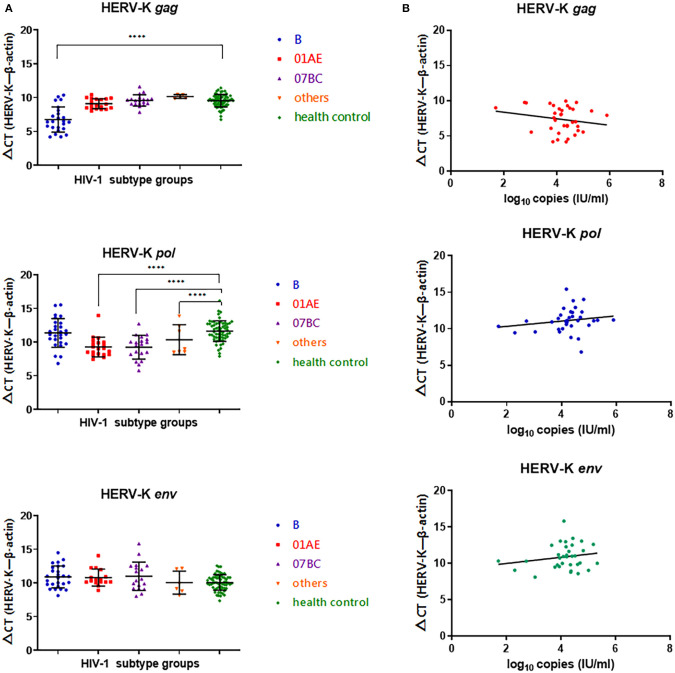
Figure 1.
(A) Blue represents HIV-1B subtype-infected persons, red represents HIV-1 CRF01_AE subtype-infected persons, purple represents HIV-1 CRF07_BC-infected persons, yellow represents other CRFs and URFS-infected persons, and green represents the healthy population control group. The Y-axis is ΔCT = CTHERV−K−CTβ−actin. *P < 0.05, **P < 0.01, ***P < 0.001, ****P < 0.0001. (B) Red represents transcriptional levels in the HERV-K gag region, blue represents transcriptional levels in the HERV-K pol region, and green represents transcriptional levels in the HERV-K env region. The Y-axis is ΔCT = CTHERV−K−CTβ−actin. The X-axis represents log10 of the viral load in each infected person. Connecting curves are indicated.

