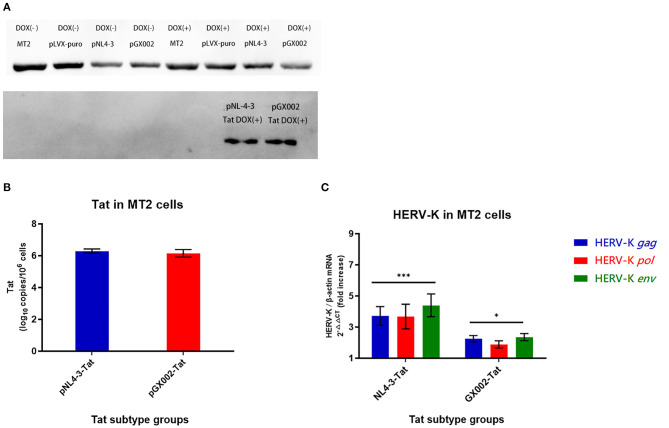
Figure 5.
(A) pNL4-3 and pGX002 in the DOX(+) groups expressed large amounts of Tat protein; MT2 cells in the uninfected group and the blank plasmid-transfected group DOX(+) did not express Tat protein; all MT2 cells in the DOX(-) groups did not express Tat protein. (B) Red represents the pGX002 group, blue represents the pNL4-3 group. The Y-axis represents log10 of the Tat gene load, and the units are indicated in the title of the Y-axis. Standard errors for triplicate experiments are indicated. (C) Blue represents HERV-K gag, red represents HERV-K pol, green represents HERV-K env. The X-axis is Tat subtype groups. The Y-axis shows the fold increase in transcription level in the HERV-K gag, pol, env region calculated by the 2−ΔΔCT method. Standard errors for triplicate experiments are indicated. *P < 0.05, **P < 0.01, ***P < 0.001.

