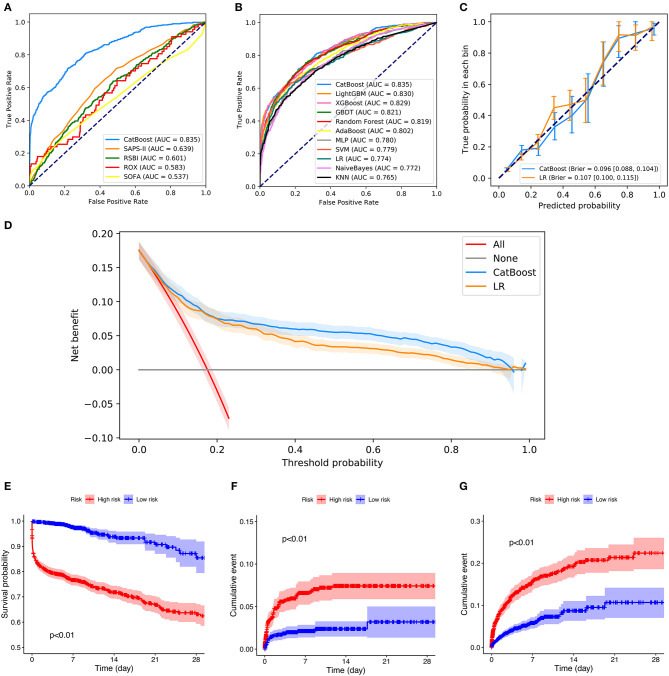
Figure 5.
Comparison of model performance in the internal validation set. (A) Receiver operating characteristic curves (ROCs) of CatBoost and other predictive factors. (B) Receiver operating characteristic curves (ROCs) of different models. (C) Calibration plot of CatBoost model and Logistic Regression (LR). (D) Decision curve analysis of CatBoost and LR. (E) Kaplan Meier analysis of 28-day survival in the high- and low-risk groups; (F) Cumulative NIV events in the high- and low-risk groups; (G) Cumulative reintubation events in the high- and low-risk groups. AUC, area under the curve; RSBI, Rapid Shallow Breathing Index; SOFA, Sequential Organ Failure Assessment; SAPS-II, Simplified Acute Physiology Score-II; ROX, the ratio of pulse oximetry/fraction of inspired oxygen to respiratory rate; XGBOOST, eXtremely Gradient Boosting; GBDT, Gradient Boosting Decision Tree; KNN, K-Nearest Neighbor; SVM, Support Vector Machine; MLP, Multi-Layer Perceptron; LR, Logistic Regression; PPV, Positive Predictive Value; NPV, Negative Predictive Value.

