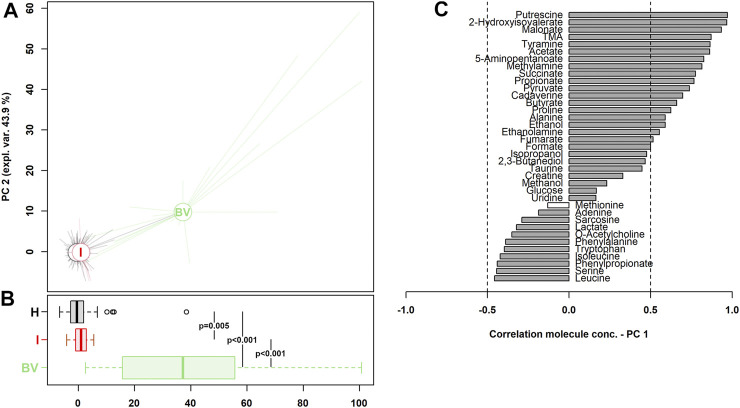
FIGURE 2.
rPCA model built on the centered and scaled concentrations of the metabolites showing significant differences between groups (H vs I vs BV). (A) In the scoreplots, women with a healthy vaginal status (H), an intermediate flora (I) and a BV-related microbiota (BV) are represented in black, red, and green respectively, with lines connecting each subject to the median of its group. (B) The respective boxplots summarize the position of the groups along PC1. In the barplot (C), describing the correlation between the concentration of each molecule and its importance over PC1, dark gray bars highlight statistically significant correlations (p < 0.05).

