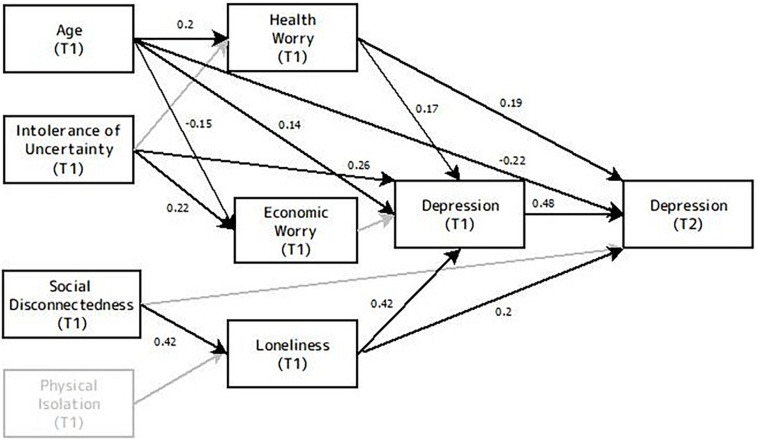
FIGURE 3.
Model of the relationships among age, economic worry, health worry, physical isolation, social disconnectedness, loneliness, intolerance of uncertainty, depression levels from phase 1 and symptoms of depression in phase 2. T1 indicates variables from phase 1, and T2 indicates variables from phase 2. Black lines represent connections in the best fitted model. Gray lines represent non-significant connections that are not included in the final model. Values embedded in unidirectional arrows are standardized regression weights.

