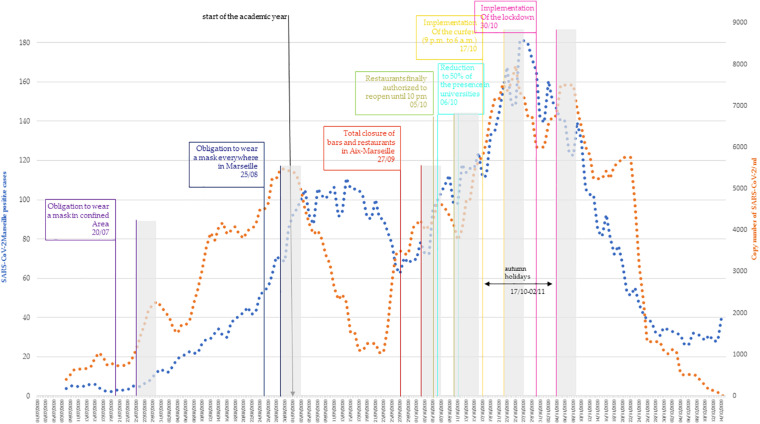
FIGURE 3.
Correlation of SARS-CoV-2 Marseille new positives cases (blue curve) and copy number of SARS-CoV-2 in RU + RS wastewater networks (orange curve). Eight-days moving average was represented. The measures implemented by government were positioned at the day of application. In gray, the period where efficiency of the measures can be observed.

