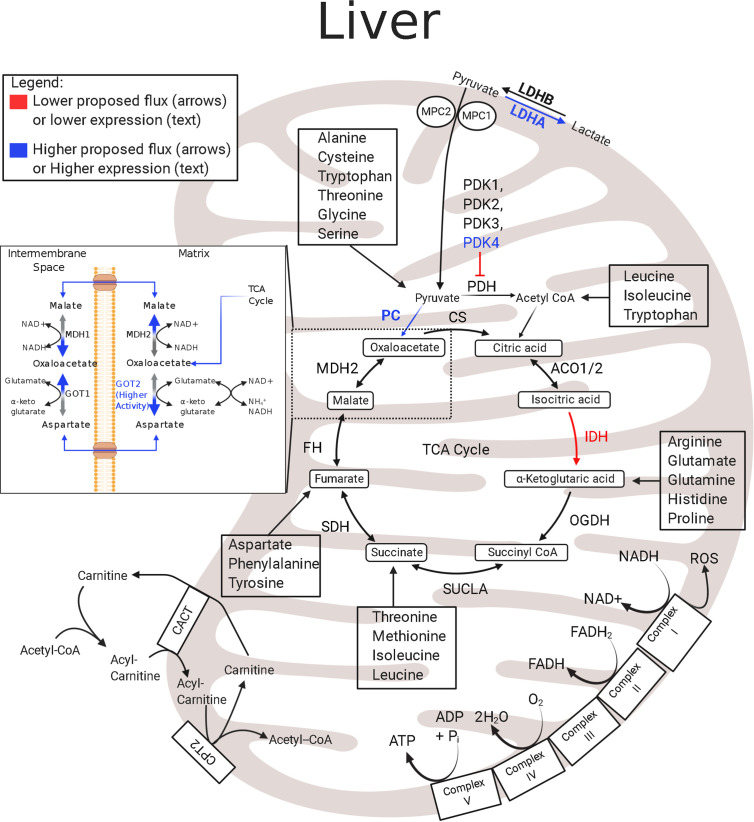
Figure 2.
Enzymatic profile for liver mitochondria in the IUGR fetus. The schematic outlines major mitochondrial enzymes and their processes in the tricarboxylic acid (TCA) cycle and electron transport chain (ETC). Lower abundances (red text) and greater abundances (blue text) for IUGR mitochondria are indicated, whereas enzymes that are not different from the control mitochondria are in black text (133, 135, 136). Proposed decreased metabolic fluxes in IUGR mitochondria are shown with red (lower) and blue (higher) arrows. Here, pyruvate oxidation in the hepatic mitochondria is speculated to be lower due to higher PDK4 and LDHA expression. In addition to lowering pyruvate oxidation, these changes are thought to push pyruvate flux towards gluconeogenesis, evidenced by higher PC expression and lower IDH expression. The lower IDH expression may act to slow pyruvate oxidation in the hepatic TCA cycle upstream of α-ketoglutarate and allow amino acids to become the primary oxidizable substrate in the TCA cycle downstream of IDH. ACO1/2, aconitate hydratase 1/2; CACT, carnitine-acylcarnitine carrier; CPT2, carnitine palmitoyltransferase 1,2; CS, citrate synthase; FH, fumarate hydratase; GOT1, glutamic-oxaloacetic transaminase 1; GOT2●, glutamic-oxaloacetic transaminase 2 (136); IDH‡, isocitrate dehydrogenase (133); LDHA‡, lactate dehydrogenase A; LDHB, lactate dehydrogenase B; MDH1, malate dehydrogenase 1; MDH2, malate dehydrogenase 2; MPC2, mitochondrial pyruvate carrier 2; OGDH, oxoglutarate dehydrogenase; PC‡, pyruvate carboxylase (135); PDH‡, pyruvate dehydrogenase (135); PDK1-4‡, pyruvate dehydrogenase kinases 1-4 (135); SDHA–D, succinate dehydrogenase A–D; SUCLA2, succinate-CoA ligase ADP-forming subunit β. ‡denotes mRNA data, ●denotes activity data. The image was created in BioRender.com.

