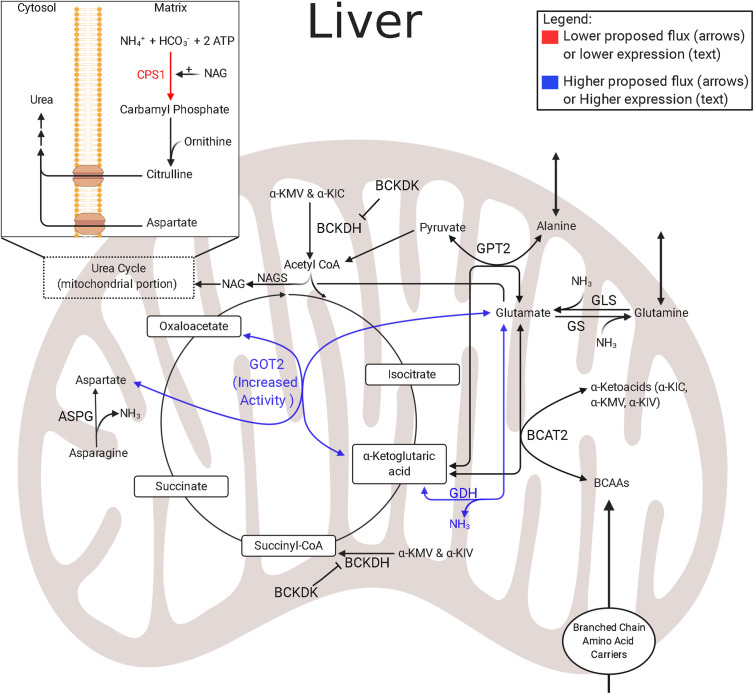
Figure 4.
Amino acid and nitrogen-balance enzymes in IUGR liver. The schematic outlines major mitochondrial enzymes and their processes in amino acid metabolism and nitrogen balance, created using BioRender.com. Lower abundances (red text) and greater abundances (blue text) are indicated for IUGR mitochondria compared to control mitochondria, whereas enzymes that are not different are in black text (136). Proposed decreased metabolic fluxes in IUGR mitochondria are shown with red (lower) and blue (higher) arrows. The flux of glutamate into the hepatic TCA cycle is proposed to be higher due to higher expression or activity of enzymes governing glutamate metabolism, such as GOT2 and GDH. However, the suspected increased reliance on amino acids is thought to lead to increased ammonia production in the IUGR liver. This may be further complicated by an inability to release ammonia as urea due to lower CPS1 expression. ASPG, asparaginase; BCAT2, branched chain amino acid transaminase 2; BCKDK, branched chain keto acid dehydrogenase kinase; CPS1†, carbamoyl-phosphate synthase 1 (136); GDH†, glutamate dehydrogenase (136); GLS, glutaminase; GOT2†, aspartate aminotransferase (136); GPT2, alanine aminotransferase 2 (121); GS, glutamine synthetase; NAGS, N-acetylglutamate synthase. †denotes protein data. The image was created in BioRender.com.

