FIGURE 1.
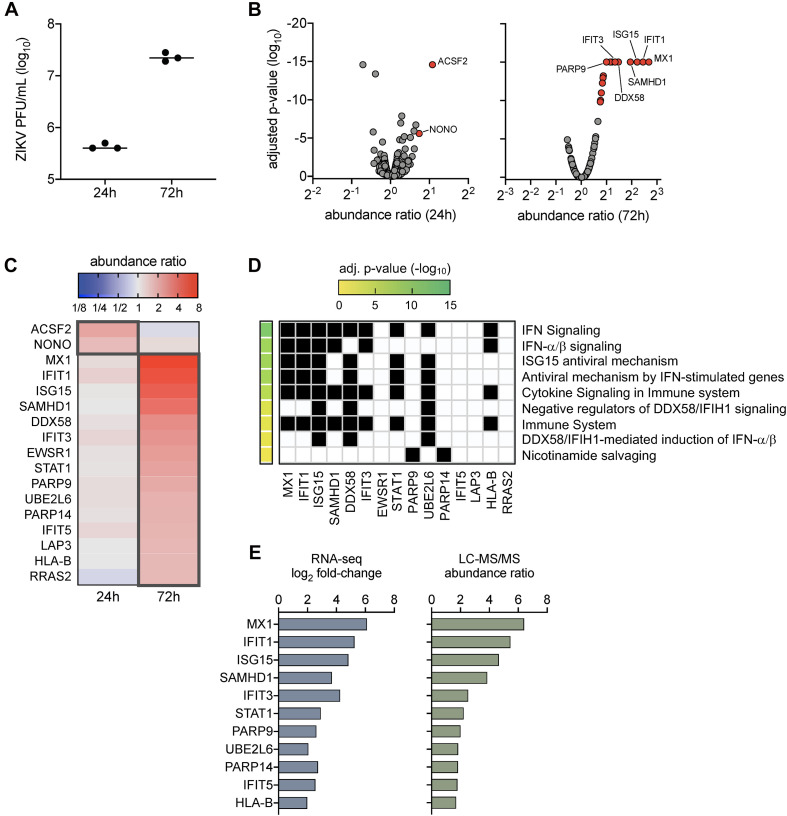
Proteome profiles of Sertoli cells following ZIKV infection. (A) ZIKV titers in SC were quantified by plaque assay at 24 and 72 h post-infection (1 h exposure at MOI 3). (B–D) Proteome analysis was conducted on mock (n = 3) and infected (n = 3) SC at 24 and 72 h post-infection using the LC-MS/MS platform. Acquired MS/MS protein searches were performed using ProteomeDiscoverer 2.1 Sequest HT (Thermo Fisher Scientific) and human (taxID 9606) subset of the SwissProt database. Protein abundance ratios (ZIKV/mock) were determined by direct comparison of time-matched samples (n = 3 for each mock and infected at each time point). Significance determined using one-way ANOVA and p-values adjusted for multiple comparisons using two-stage linear step-up procedure of Benjamini, Krieger, and Yekutieli, false discovery rate (FDR) of 5%. (B) Volcano scatter plot of abundance ratio versus adjusted p-value of identified proteins at 24 and 48 h post-infection. Only protein abundance ratios of > 1.6 or < 0.6 with an adjusted p < 0.05 were considered significant. Gray data points represent abundance ratios that were insignificant, red data points represent upregulated proteins, and blue data points represent downregulated proteins. (C) Heatmap comparison of the differentially regulated proteins (DRPs; proteins with significant abundance ratios) at 24 and 72 h post-infection. Dark gray outline denotes DRPs for each time point. (D) Pathway enrichment matrices of 72 h DRPs were determined using Reactome annotations (https://reactome.org) within the g:Profiler web server, g:GOSt functional profiler option (https://biit.cs.ut.ee/gprofiler/gost). Significance threshold was set to g:SCS with adjusted p-value of < 0.05. (E) Comparison profile between DRPs and their encoding differential expressed genes (DEGs) identified using RNA-Seq analysis in our previous study in ZIKV-infected SC at 72 h post-infection.

