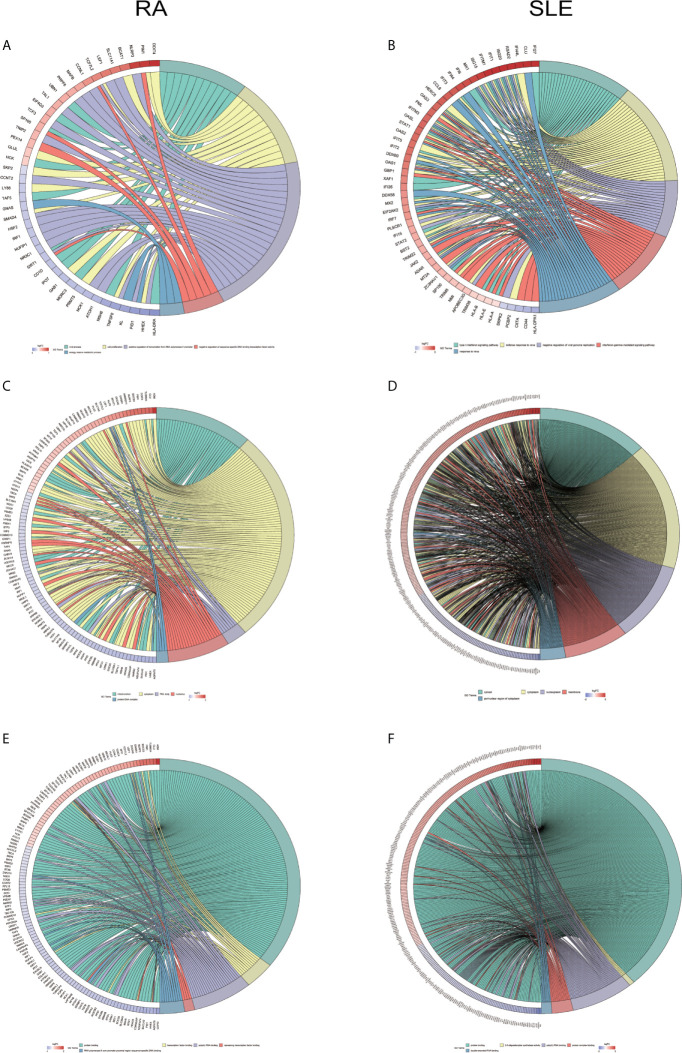
Figure 9.
Chord plot showing a relationship between aberrantly methylated DEGs of CD14+ monocytes between RA and SLE. (A) Top 5 GO terms of biological process in RA and (B) SLE; (C) Top 5 GO terms of cellular components in RA and (D) SLE; (E) Top 5 GO terms of molecular functions in RA and (F) SLE. GO, Gene Ontology.

