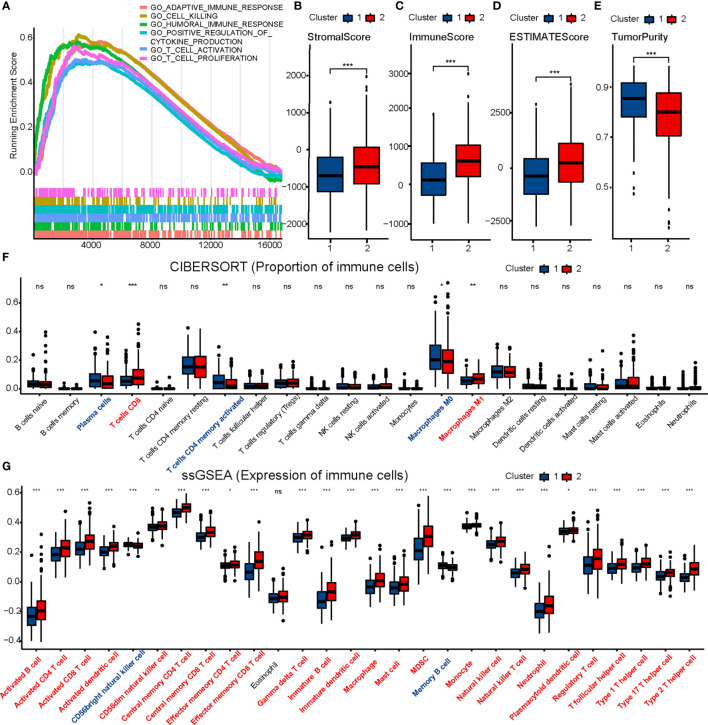
Figure 2.
Comparison of immune characteristics between two clusters. Comparison of functional enrichment (A), stromal score (B), immune score (C), ESTIMATE score (D), tumor purity (E), proportion of immune cells (F) and expression of immune cells (G) between two clusters. The P values are labeled using asterisks (ns, no significance, *P < 0.05, **P < 0.01, ***P < 0.001).

