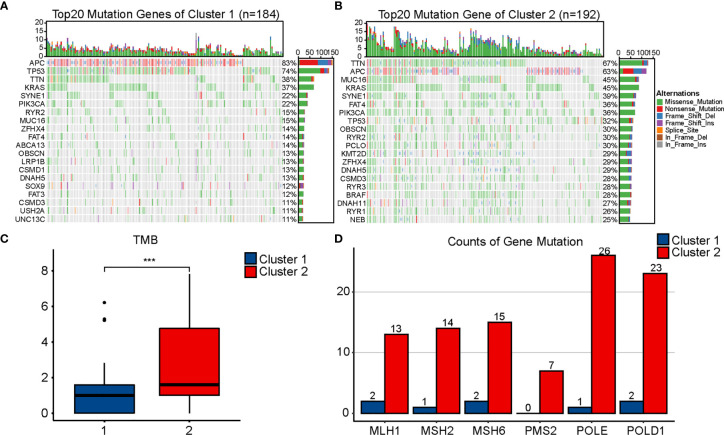
Figure 4.
Comparison of mutational landscapes between two clusters. Mutational landscape of Cluster 1 (A) and Cluster 2 (B). (C) Comparison of tumor mutation burden (TMB) between two clusters. (D) Comparison of gene mutation related to mismatch repair and POLE proofreading domain between two clusters. The P values are labeled using asterisks (***P < 0.001).

