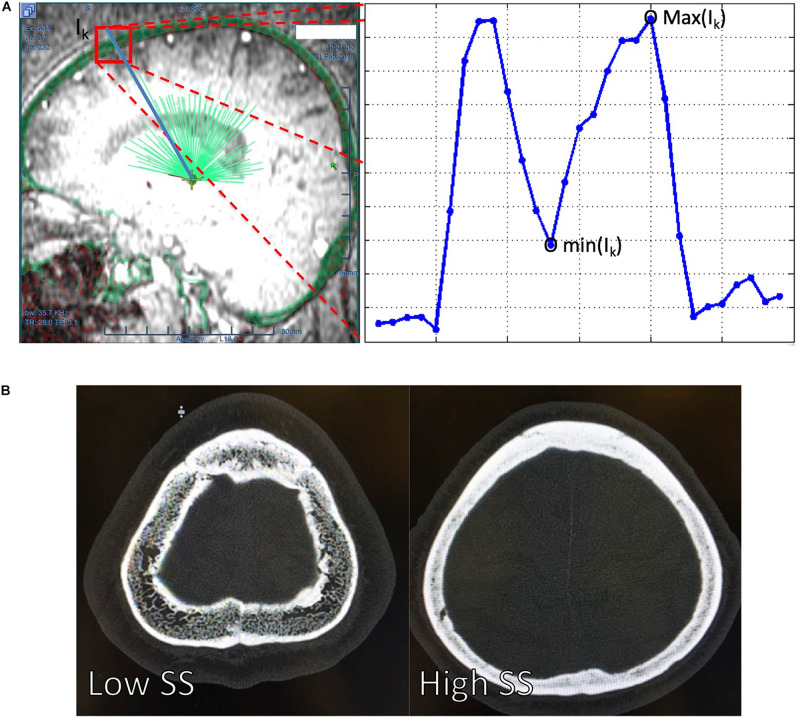
FIGURE 1.
(A) The ExAblate Neuro platform simulated the ultrasound beams (light green lines) penetrating through a skull (transparent green around the head) and extracted the maximum [max (Ik)] and minimum [min(Ik)] of the skull intensities along each of the ultrasound. The blue line at the right panel of the (A) delineated the CT image intensity changes along one of the ultrasound beam Ik. A high intensity difference between and cortical and trabecular bone might leaded to a low SS = 0.25 [(B), left] compared to high SS = 0.70, which had a relatively similar intensity between the cortical and trabecular bone [(B), right]. SS, skull score.

