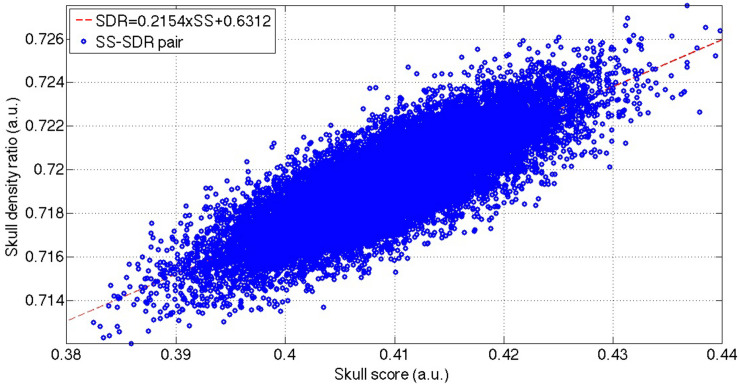
FIGURE 3.
The distribution of the bootstrapped SS-cSDR pairs and the linear correction between these SS-SDR pairs. The blue dots show the total 2,46,000 bootstrapped samples, and the red line indicates the linear fitting of these bootstrapped samples. SS, skull score; cSDR, customized skull density ratio.

