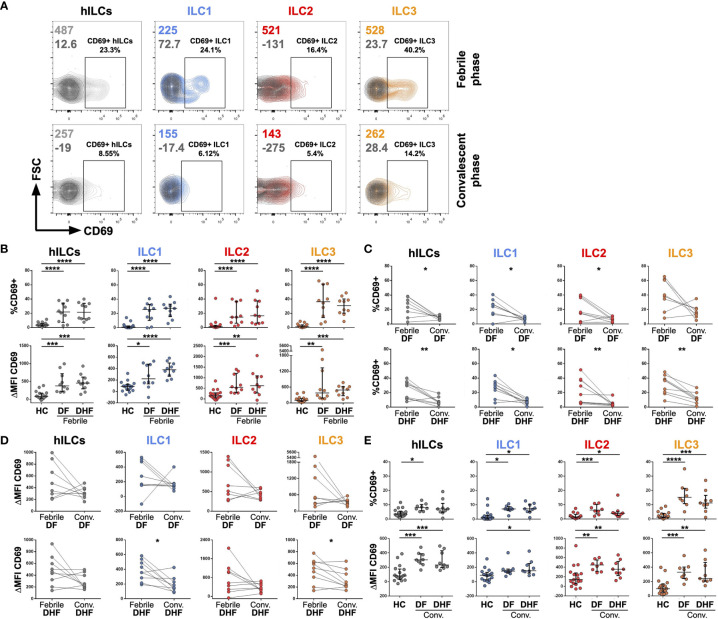
Figure 2.
Activation of hILCs during the febrile phase of DENV infection. (A) Representative contour plot of CD69 expression (light grey, blue, red, and orange) as compared with isotype control (dark grey) on total hILC and each hILC subsets in febrile phase and convalescent phases. (B) Percentage of CD69+ (upper panel) and ΔMFI (CD69 MFI - isotype control MFI) (lower panel) for total hILCs and each hILC subset in febrile phase of dengue fever (DF) patients and dengue hemorrhagic fever (DHF) patients compared to healthy donors (HC). (C) Percentage of CD69+ and (D) ΔMFI for total and hILC subsets of febrile phase compared to matched convalescent of DF (upper panel) and DHF (lower panel). Each line connected data of the same patient between two timepoints. Wilcoxon matched-pairs signed rank test was used for statistical comparison, p < 0.05 was considered as a statistically significant difference. (E) Percentage of CD69+ (upper panel) and ΔMFI (lower panel) for total and hILC subsets in convalescent phase of DF and DHF patients compared to healthy donors (HC). The results were presented as Median ± IQR. Data were analyzed using Mann-Whitney test (B, E) or Wilcoxon matched-pairs signed rank test (C, D) (*p < 0.05, **p < 0.01, ***p < 0.001, ****p < 0.0001).

