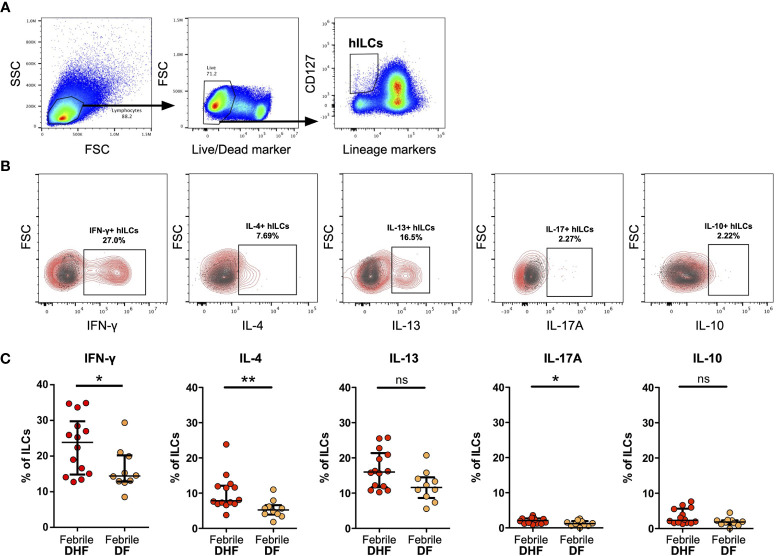
Figure 3.
Intracellular cytokine staining of hILCs from febrile DF and DHF after PMA/ionomycin ex vivo stimulation (A) Flow cytometry analysis gating strategy of total hILCs from PBMC. (B) Representative contour plots of IFN-γ, IL-4, IL-13, IL-17A, and IL-10 expression (red) overlaid on FMO control (grey). (C) Percentage of IFN-γ, IL-4, IL-13, IL-17A, and IL-10 expression of hILCs in febrile phase of DF and DHF patients. The results were presented as median ± IQR. Data were analyzed using Mann-Whitney test (*p < 0.05, **p < 0.01; ns, not significant).

