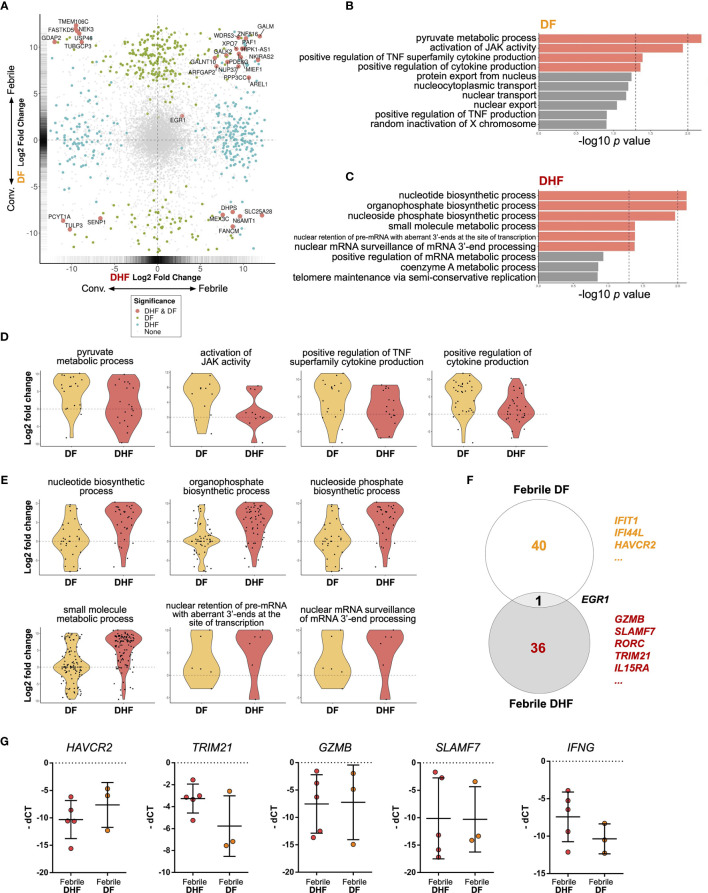
Figure 5.
Differential gene expression analysis of hILCs between febrile and convalescent phase of DENV infection (A) Plot comparing the fold change of DF (febrile over convalescent phase) (Y axis) to the fold change of DHF (febrile over convalescent phase) (X axis) depicts transcripts differentially expressed between disease severity and timepoint. Colored dots denote transcripts that are differentially expressed at least 2-fold higher as well as adjust p value less than 0.01. Blue or green colored dots denote differentially expressed in DF or DHF respectively. Red colored dots denote transcripts that are differentially expressed by both DF and DHF. (B, C) Bar plots show significant GO term enrichment from DE genes comparing febrile and convalescent phases in (B) DF and (C) DHF patients. (D, E) Violin plots show fold change of expression levels of matched samples between febrile and convalescent phases. Each dot represents a gene in the designated GO term by each patient. (D) show enriched GO term in DF patients and (E) shows GO term enriched in DHF patients. (F) Venn diagram shows number of differentially expressed genes in DF (febrile over convalescent phase), DHF (febrile over convalescent phase) and both after shrinkage algorithm ‘apeglm’ was applied. Immune-related genes are listed beside the diagram. (G) Expression levels of HAVCR2, TRIM21, GZMB, SLAMF7, and IFNG by quantitative PCR (delta Ct value (dCt) = Ct value of ACTB - Ct value of interested gene). Bar showing median ± IQR.

