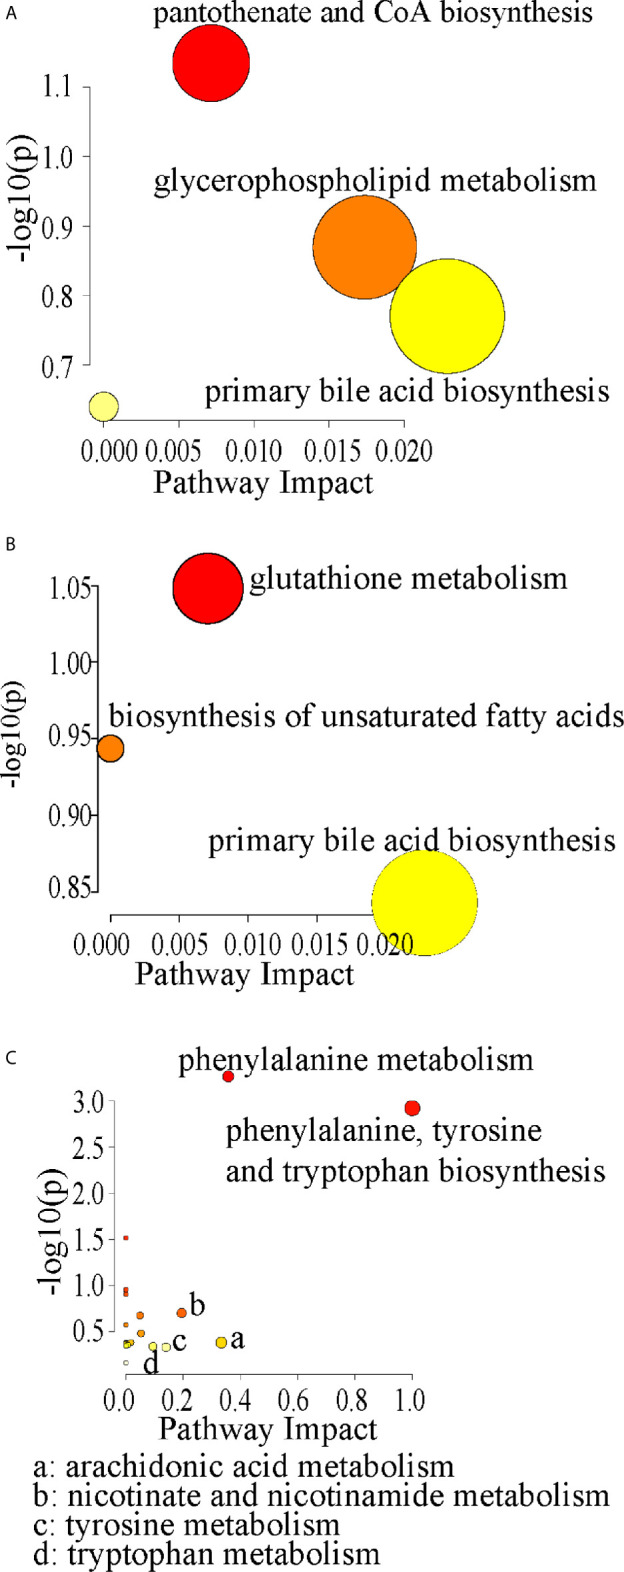
Figure 8.

Pathway analyzes of the differential metabolites in CIA (A), in CCFM1074 (B) and in CCFM1075 (C). control (vehicle-treated with saline 1.5 mL/day) group, CIA (vehicle-treated with saline 1.5 mL/day) group, methotrexate (MTX)-treated (6 mg/kg/week) group, CCFM1074 (treated with CCFM1074, 8.5 × 10⁹ CFU/day) group and CCFM1075 (treated with CCFM1075, 8.5 × 10⁹ CFU/day) group, eight rats per group.
