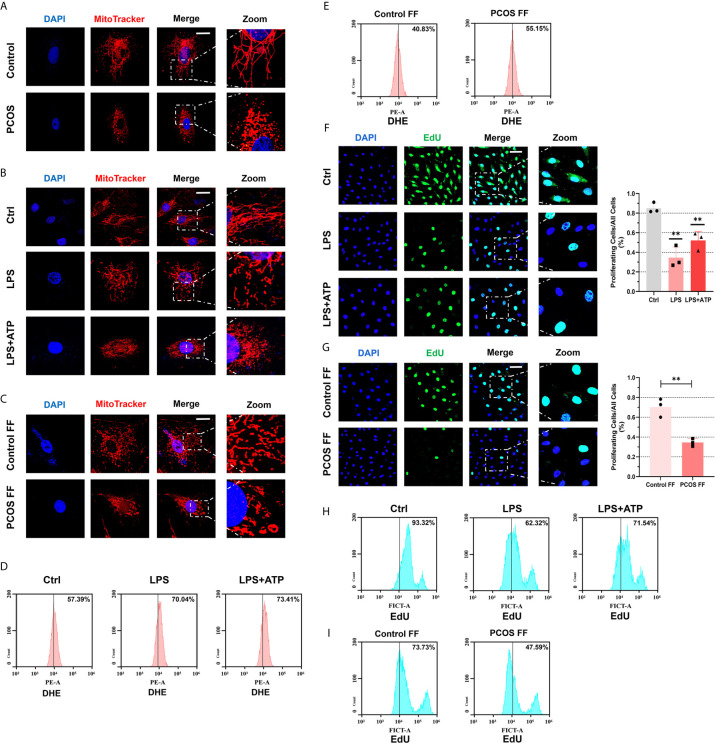
Figure 6.
Follicular fluid from PCOS patients and LPS impaired mitochondria structure and function, caused oxidative stress, and arrested cellular proliferation. (A) Immunofluorescence imaging of mitochondria in GCs from PCOS patients and controls (MitoTracker, red; DAPI, blue; scale bar, 20 μm). (B) Immunofluorescence imaging of mitochondrial morphology in KGN cells with LPS stimulation (200 ng/mL) for 3 h and ATP (4 mM) for 50 min (MitoTracker indicated mitochondria, red; DAPI, blue; scale bar, 20 μm). (C) Immunofluorescence imaging of mitochondrial morphology in KGN cells incubated with follicular fluid for 3 h (MitoTracker indicated mitochondria, red; DAPI, blue; scale bar, 20 μm). (D) After DHE staining, flow cytometry assays were used to detect ROS levels in KGN cells with LPS (200 ng/mL) treatment for 3 h and ATP (4 mM) for 50 min. (E) After DHE staining, flow cytometry assays were used to detect ROS levels in KGN cells with follicular fluid stimulation for 3 h. (F) Immunofluorescence imaging of EdU to indicate the KGN cells proliferation with LPS (200 ng/mL) treatment for 3 h and ATP (4 mM) for 50 min (EdU, green; DAPI, blue; scale bar, 50 μm). (G) Immunofluorescence imaging of EdU to indicate the KGN cells proliferation with follicular fluid treatment for 3 h (EdU, green; DAPI, blue; scale bar, 50 μm). (H) With EdU staining, flow cytometry assays were used to detect fluorescence in KGN cells with LPS (200 ng/mL) stimulation for 3 h and ATP (4 mM) for 50 min treatment. (I) After EdU staining, flow cytometry assays were used to detect fluorescence in KGN cells with treatment of follicular fluid for 3 h. **P < 0.01. *P < 0.05 was considered statistically significant.

