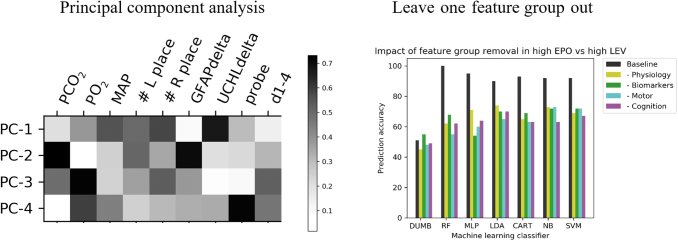
FIG. 8.
The left panel visualizes a representative principal component analysis (PCA) showing the first four principle components (PCs) in our data set, which account for 83.4% of the variance. PCA gives rise to a complex mixture of original features and the heat map pictured corresponds to the relative impact of each feature in giving rise to the PC. The right panel shows a representative example of the impact on classification accuracy following the removal of individual feature groups. EPO, erythropoietin; GFAP, glial fibrillary acidic protein; LEV, levetiracetam; MAP, mean arterial pressure.

