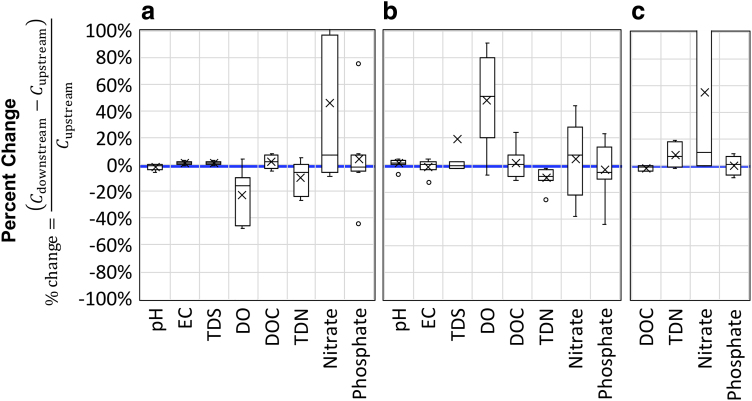
FIG. 4.
Percent differences between general water quality parameters for samples collected during dry weather conditions directly upstream and directly downstream of homeless encampments along the banks of: (a) Alvarado Creek near SDSU (N = 8); (b) Forester Channel (N = 8); and (c) the San Diego River at Fashion Valley (N = 4). Boxes show the interquartile range and the median, and whiskers show the minimum and maximum data points that are within 1.5 times the interquartile range. Plots also show mean values ( × ) and any outlier data points (°) that are less than or greater than 1.5 times the interquartile range.

