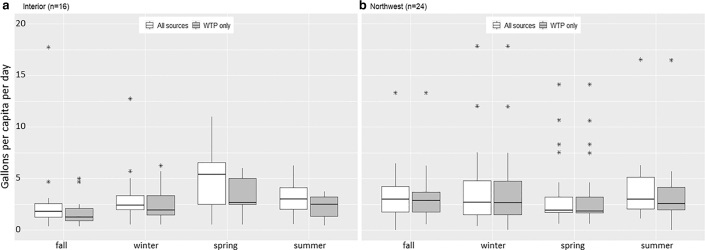
FIG. 2.
Variation in household water haul by community and season, considering all water sources versus community water treatment plant (“WTP”) only. Boxes represent interquartile range (IQR). Horizontal mid-line represents median value. Vertical lines show values less than 1.5 times the IQR. Asterisks denote outliers outside of 1.5 times the IQR above the upper quartile and below the lower quartile.

