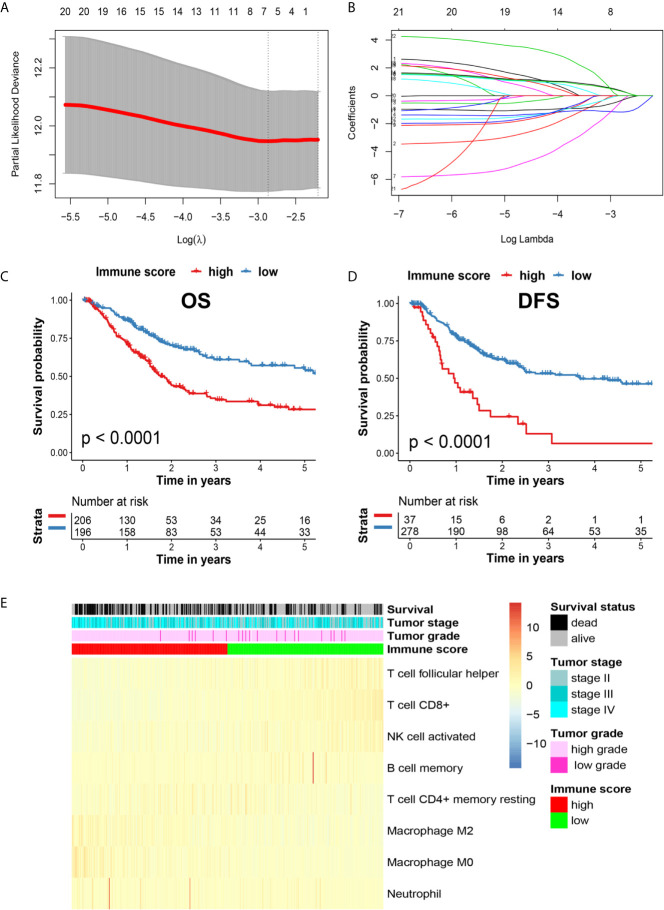
Figure 1.
(A) Illustration of LASSO coefficient profiles of 22 immune cell types. (B) Cross-validation for the LASSO regression model. (C) Kaplan-Meier analysis of OS in high and low immune score patients with MIBC in the TCGA cohort. (D) Kaplan-Meier analysis of DFS in patients with high and low immune scores with MIBC in the TCGA cohort. (E) Heatmap of the related immune cells with high and low immune scores.

