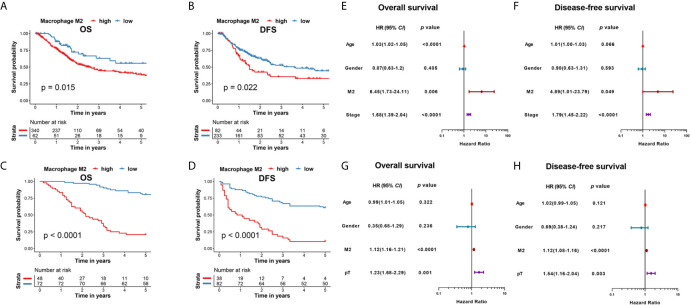
Figure 2.
(A) Kaplan–Meier analysis of OS in patients with MIBC with M2 TAMs in the TCGA cohort. (B) Kaplan–Meier analysis of DFS in patients with MIBC with M2 TAMs in the TCGA cohort. (C) Kaplan–Meier analysis of OS in patients with MIBC with M2 TAMs in the Shanghai General Hospital cohort. (D) Kaplan–Meier analysis of DFS in patients with MIBC with M2 TAMs in the Shanghai General Hospital cohort. (E) Forest plot showing the hazard ratios with a 95% confidence interval for OS in the TCGA cohort. (F) Forest plot showing the hazard ratios with a 95% confidence interval for DFS in the TCGA cohort. (G) Forest plot showing the hazard ratios with a 95% confidence interval for OS in the Shanghai General Hospital cohort. (H) Forest plot showing the hazard ratios with a 95% confidence interval for DFS in the Shanghai General Hospital cohort.

