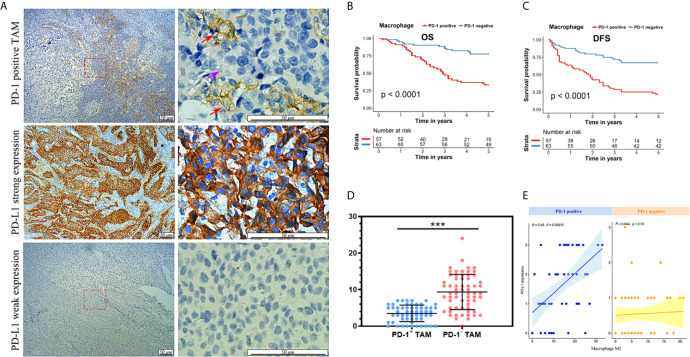
Figure 3.
(A) Immunohistochemical staining of PD-1-positive TAMs (red arrow), PD-1-negative TAMs (purple arrow), strong PD-L1 and weak PD-L1 expression. (B) Kaplan-Meier analysis of OS in patients with MIBC with PD-1-positive TAMs in the Shanghai General Hospital cohort. (C) Kaplan-Meier analysis of DFS in patients with MIBC with PD-1-positive TAMs in the Shanghai General Hospital cohort. (D) PD-1-positive TAMs showed less CD8-postive T cells nearby. ***p < 0.001 (Student’s t-test). (E) The number of PD-1-positive TAMs showed a correlation with PD-L1 expression in the Shanghai General Hospital cohort.

