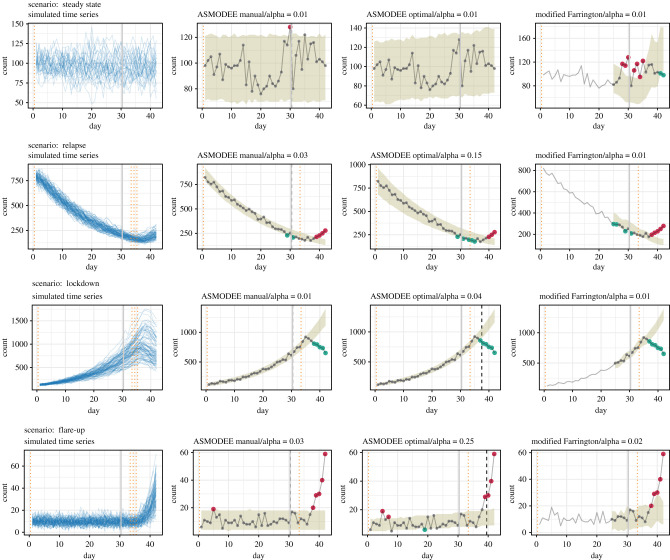
Figure 1.
Simulations under four scenarios and illustration of the detection algorithm. Left column: the blue lines show time series generated under the four scenarios steady state (30 simulations), relapse, lockdown and flare-up (90 simulations each). The vertical solid grey lines mark the beginning of the observation period, the dotted orange lines the time at which a trend change occurs. Second to fourth columns: application on a single time series from each scenario of the configurations ASMODEE manual, ASMODEE optimal and the modified Farrington algorithms. The grey lines show the simulated time series, the ribbons show the prediction interval for the value of alpha indicated, and the dashed black lines mark the end of the calibration period for ASMODEE. The red dots show data points categorized as increase, the green dots those categorized as decrease, the grey ones are considered normal. The values of alpha were set so as to maximize the 6-day probability of detection. modified Farrington does not produce results for the first training period.

