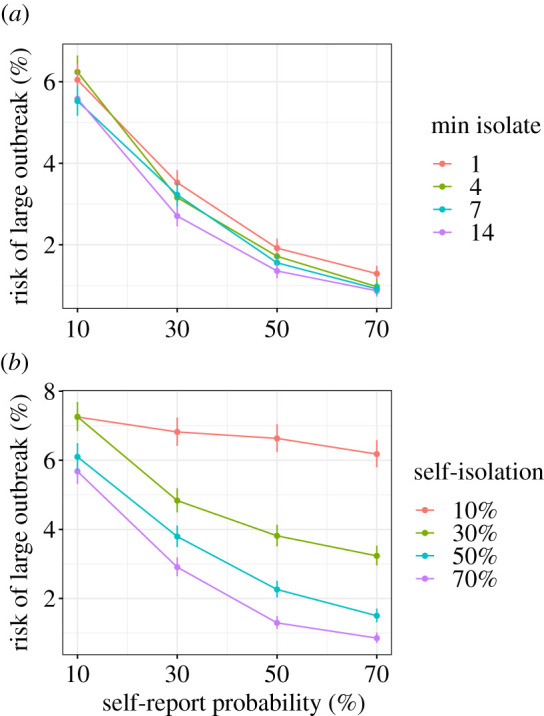
Figure 3.

Trade-off between (a) minimum self isolation time and self-report probability, and (b) self-isolation probability and self-report probability. The control effectiveness is held constant at 60%. The results are a subset of those in figures 2 and 4, with each line being a slice through a column of those plots. The y-axis shows the risk of a large outbreak (greater than 2000 cases) over 15 000 simulations. Error bars show the 95% confidence intervals. In (a) if we optimistically assume we currently have 70% self-report probability but 1 day minimum isolation (red), legally mandating isolation would be expected to move us to the left and to the purple line which gives an increased risk of an outbreak. In (b) if we optimistically assume we currently have 70% self-report probability but 10% self isolation probability (red), legally mandating isolation would be expected to move us to the left and to the purple line which gives a marginal decrease in risk of an outbreak. (Online version in colour.)
